Shopkick
Shopkick is an app that rewards you for shopping in-store and online. Earn reward points (kicks), then redeem for a wide selection of free gift cards! How? By walking into a partner store, scanning select products, or making purchases. Shopkick is on a mission to bring delight and reward to the consumer shopping experience transforming the way people engage with stores and products, both online and in the physical world.
Challenges
- 50,000 new users install the app every week, of which 8,300 of them activate. A month later, we are left with ~2,000 users.
- Unclear value proposition—users don’t understand how the app improves their lives or what problems it solves.
- Confusing user journey—users are unsure how to get started or what actions to take.
- Limited product variety—lack of inventory diversity.
- Poor personalization—users see irrelevant products.
- Low engagement—users forget to open the app when needed; it lacks strong internal triggers.
Role & Responsibilities
- Manage a team of 8 designers (4 Product Designers, 3 Marketing Designers, 1 User Researcher)
- Vision and goal setting cross-functionally
- Create a process to follow when designing new features
- Led the initial research (Qualitative Data)
- Analyze data with Data Engineers and PM's to determine next projects (Quantitative Data)
IMPACT
Collaboration
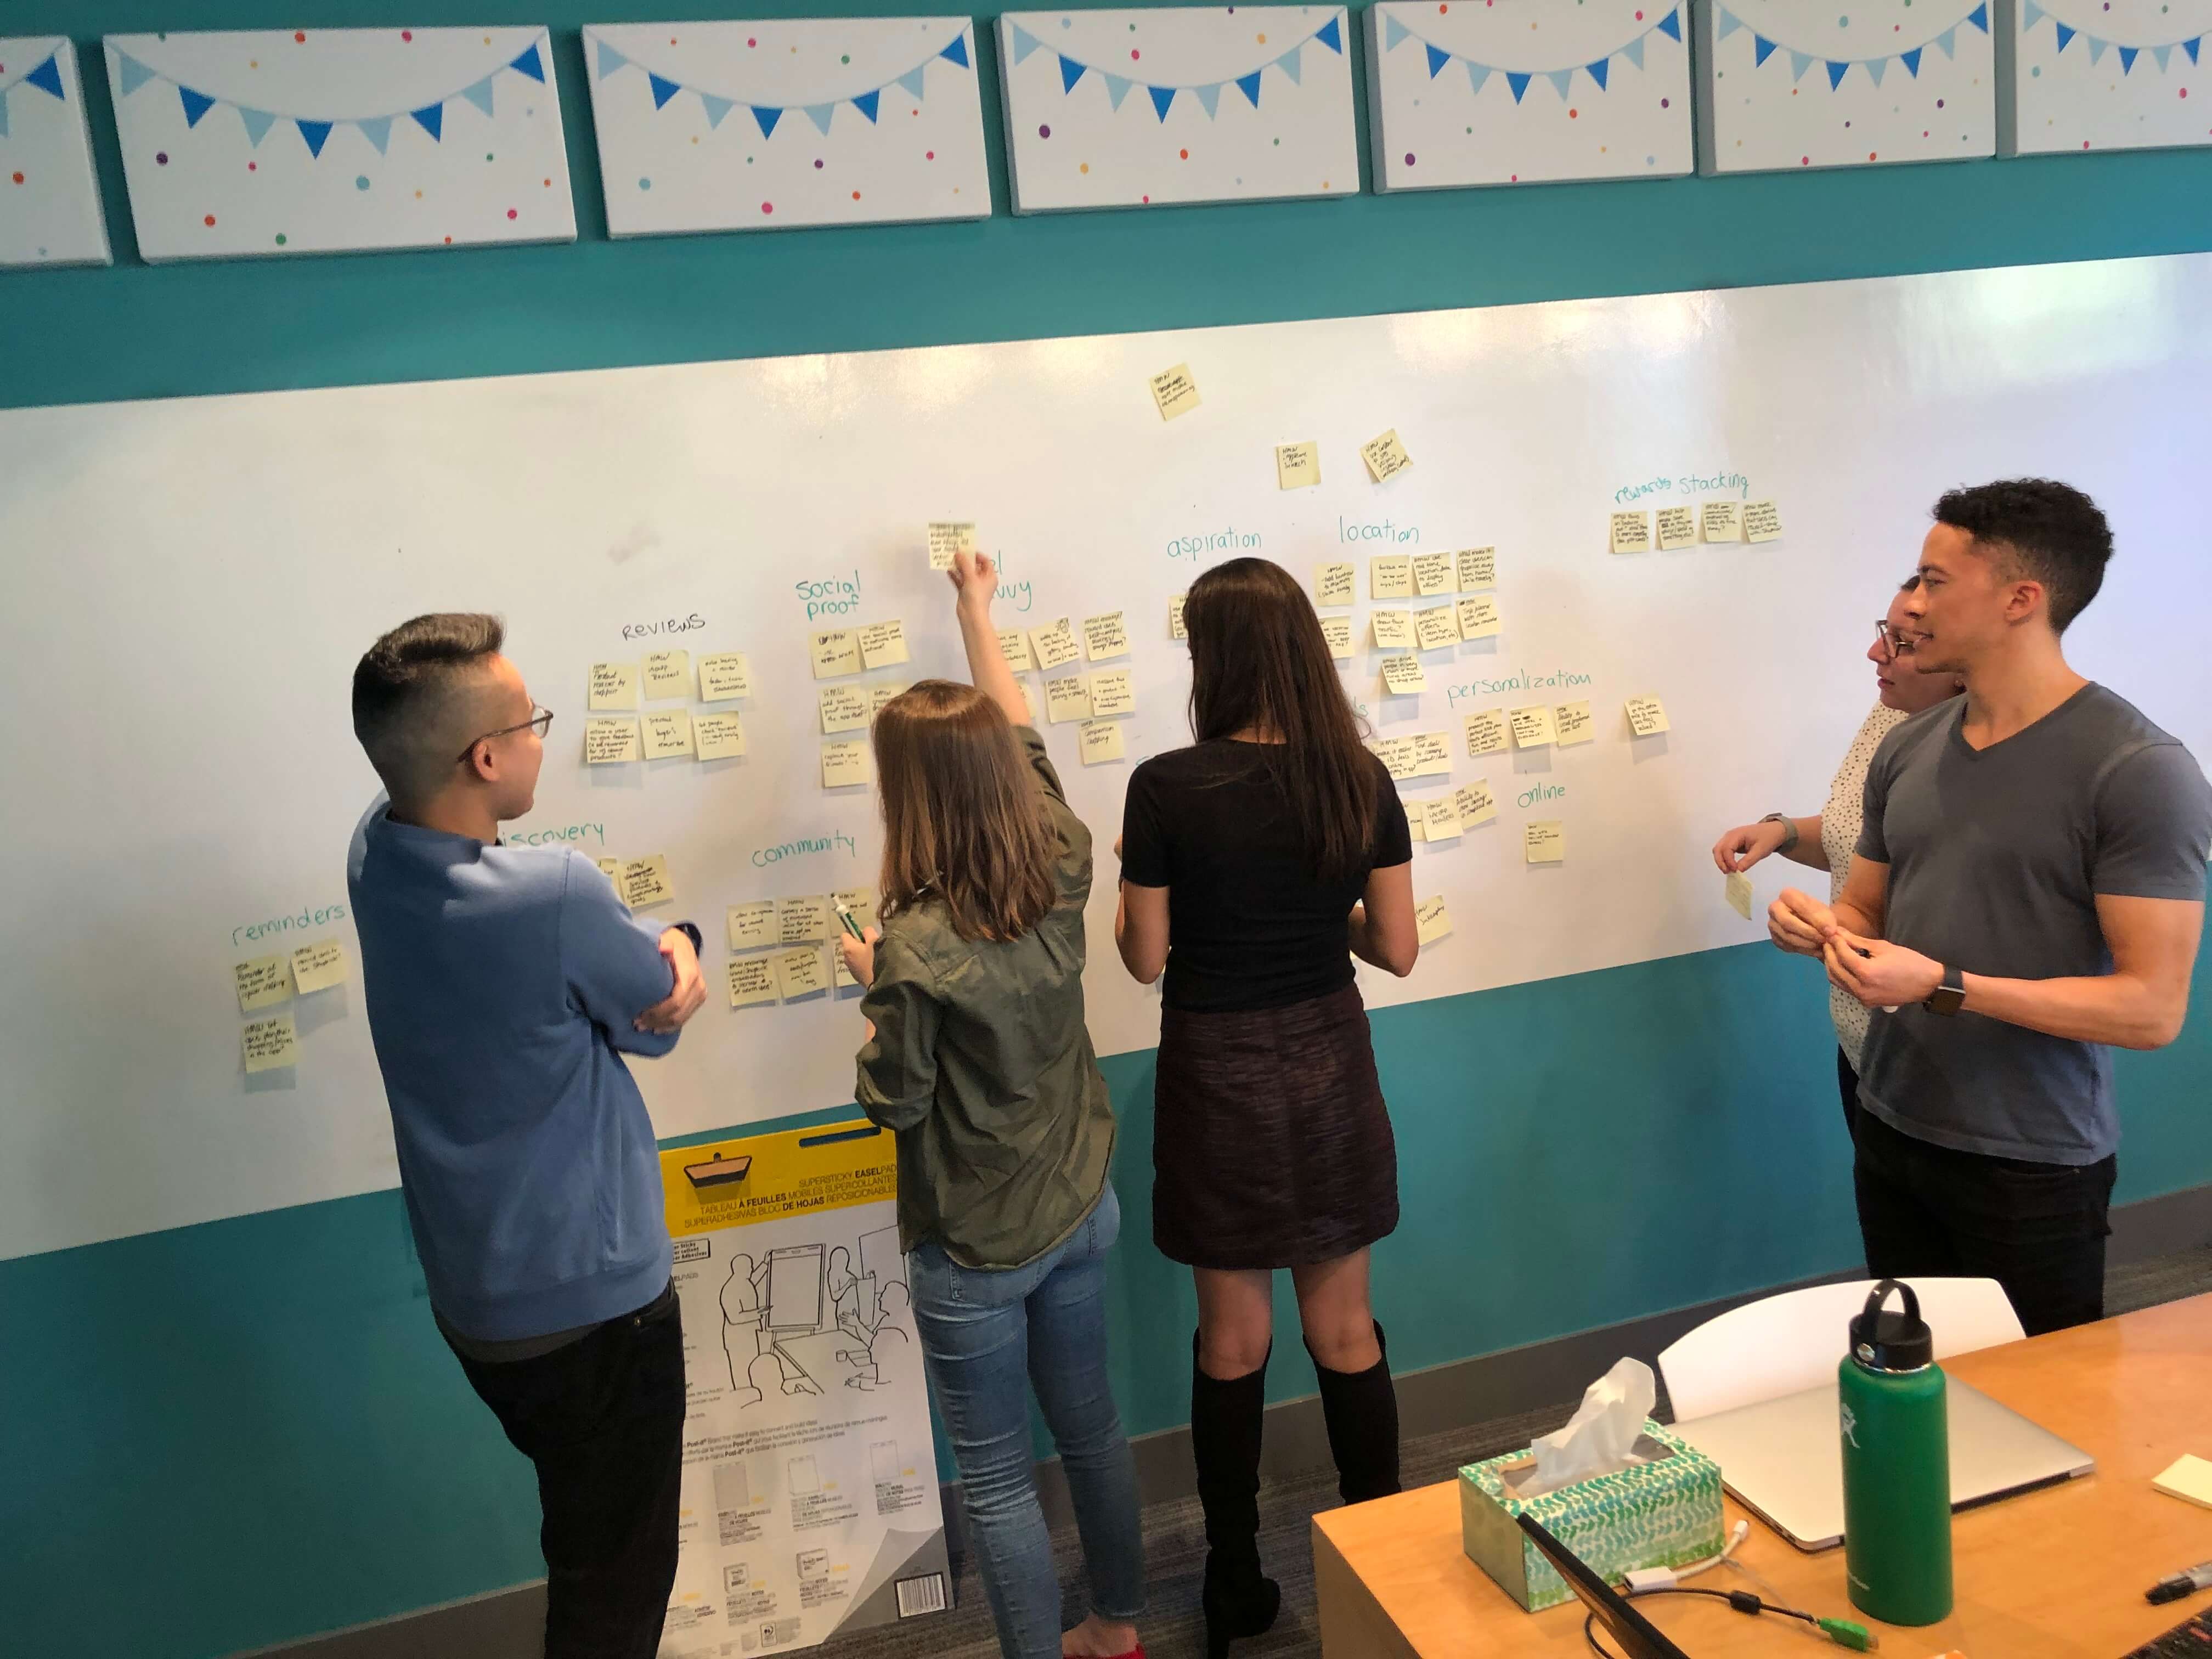
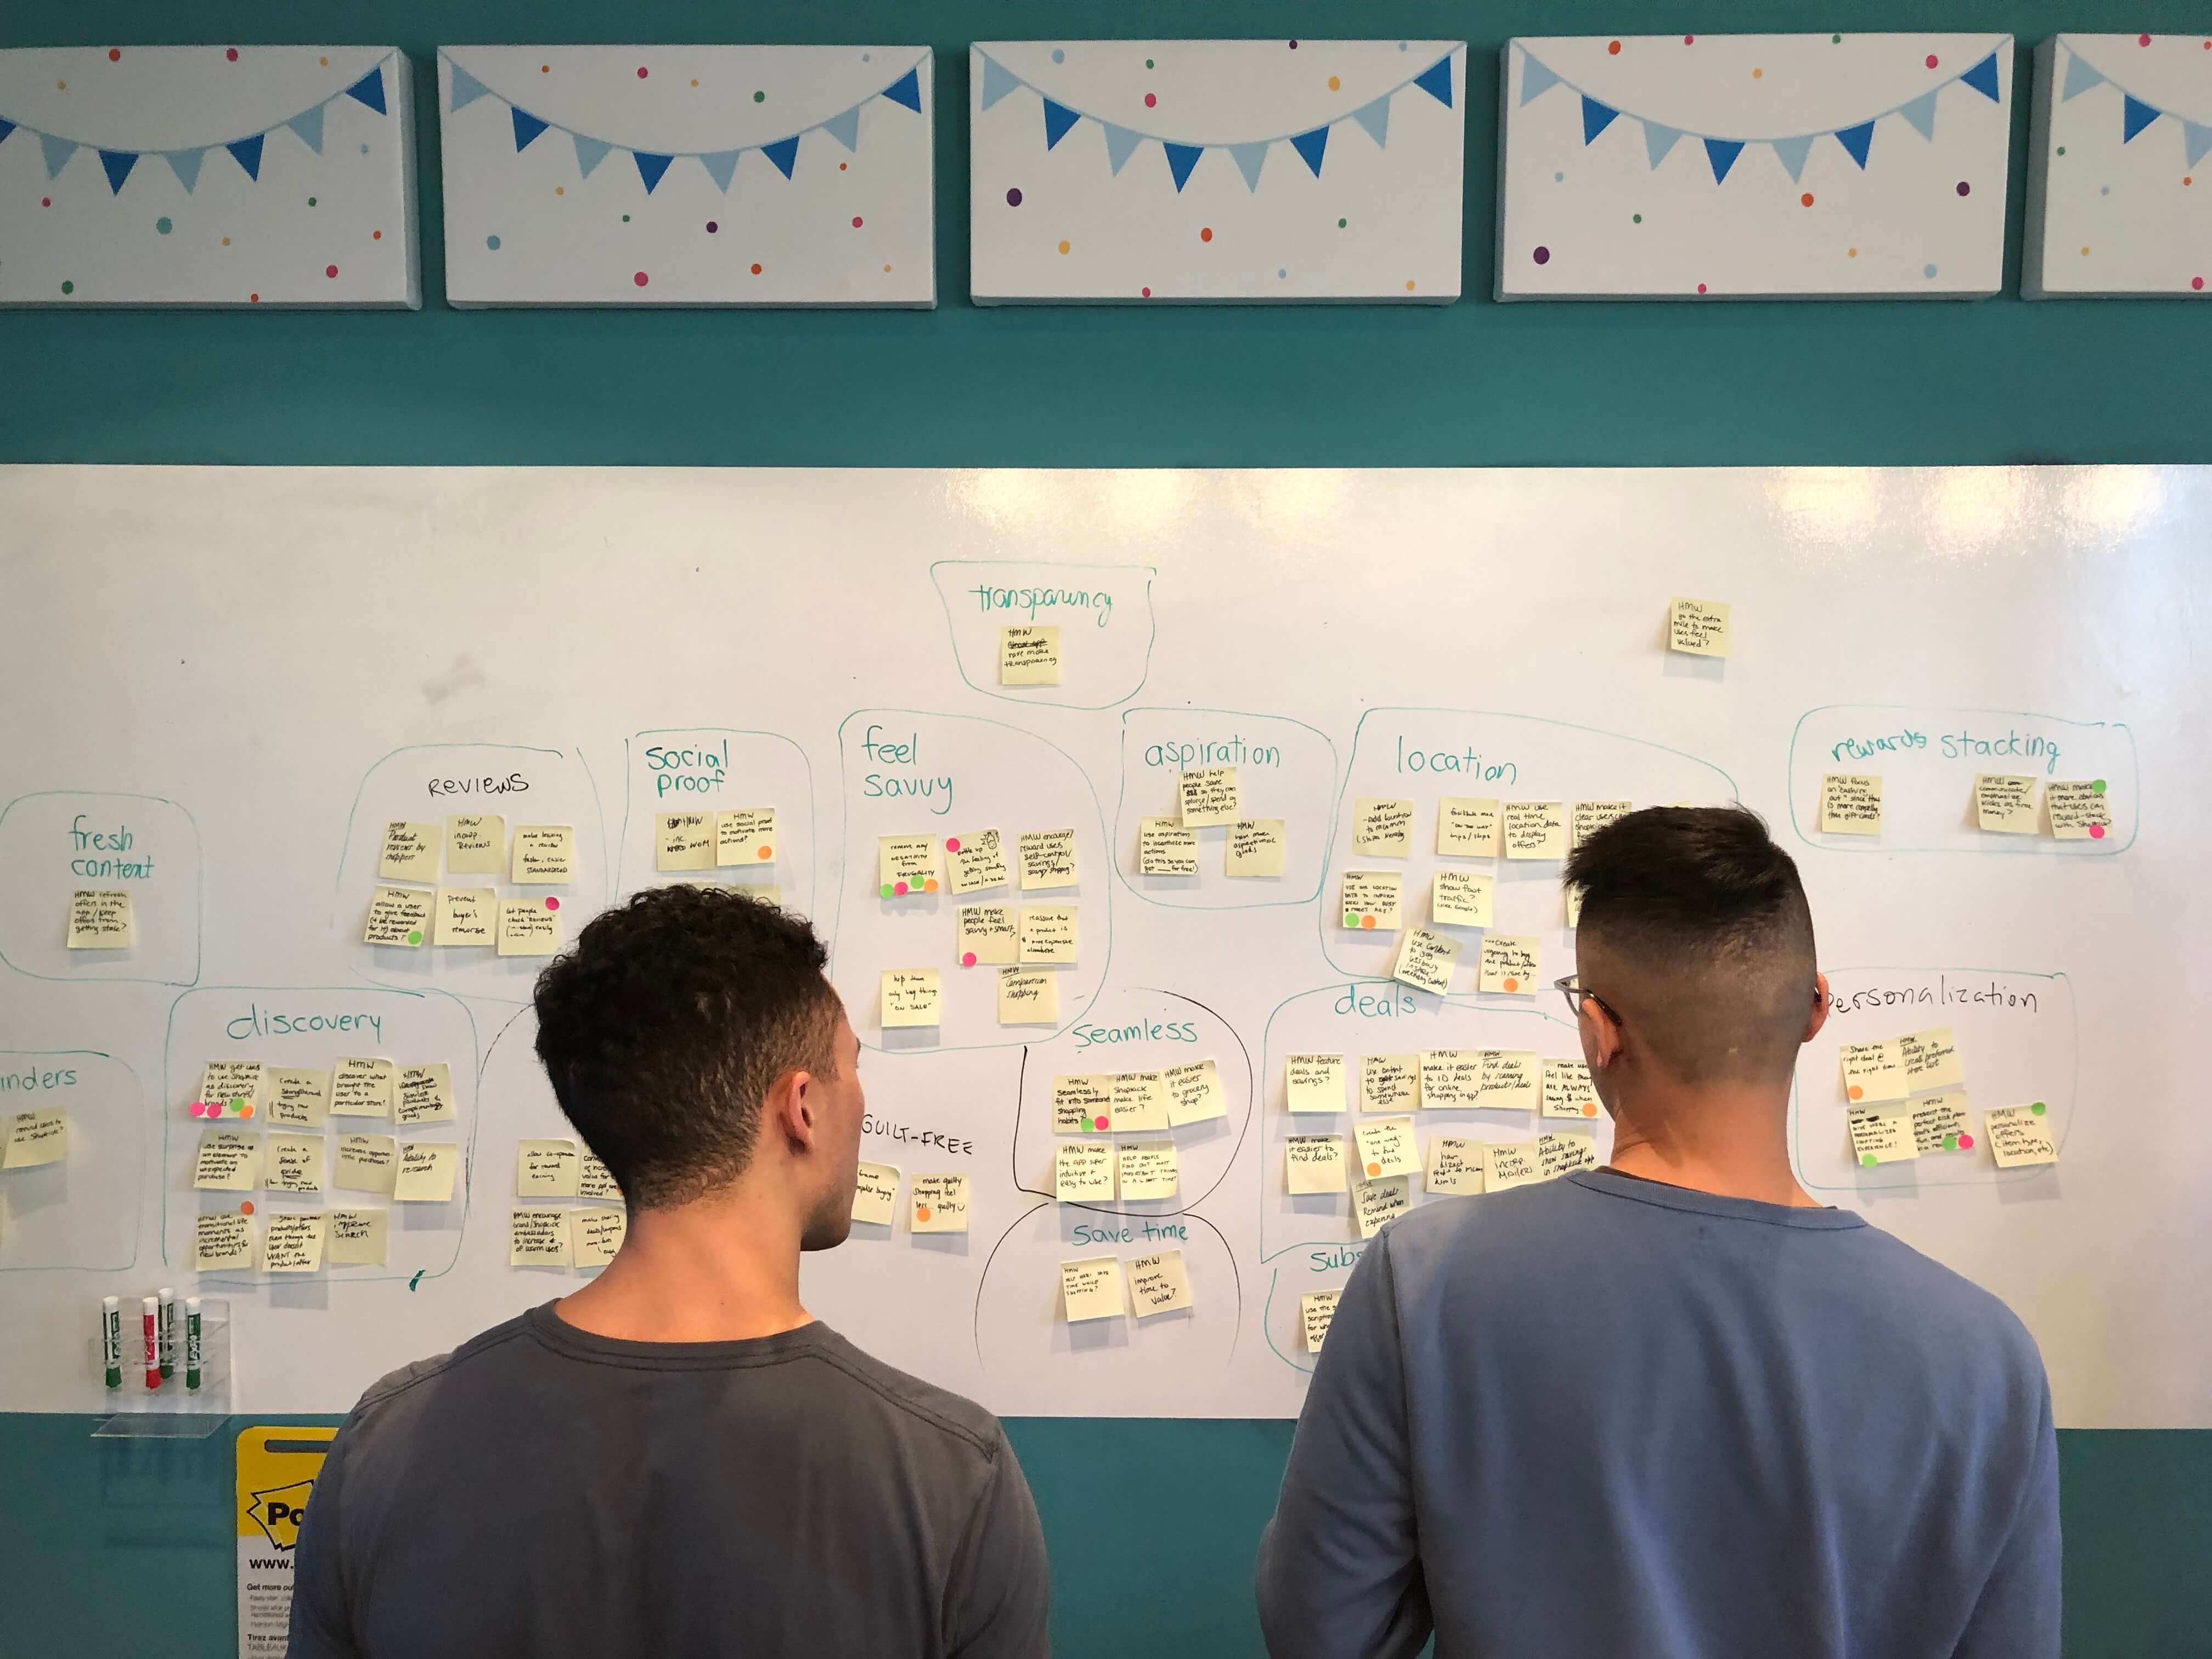
The goal of the cross-functional collaboration exercises I led was to share knowledge on what our existing and non-users like/want/need, clearly define what we felt was crucial for success, and develop long-term concepts.
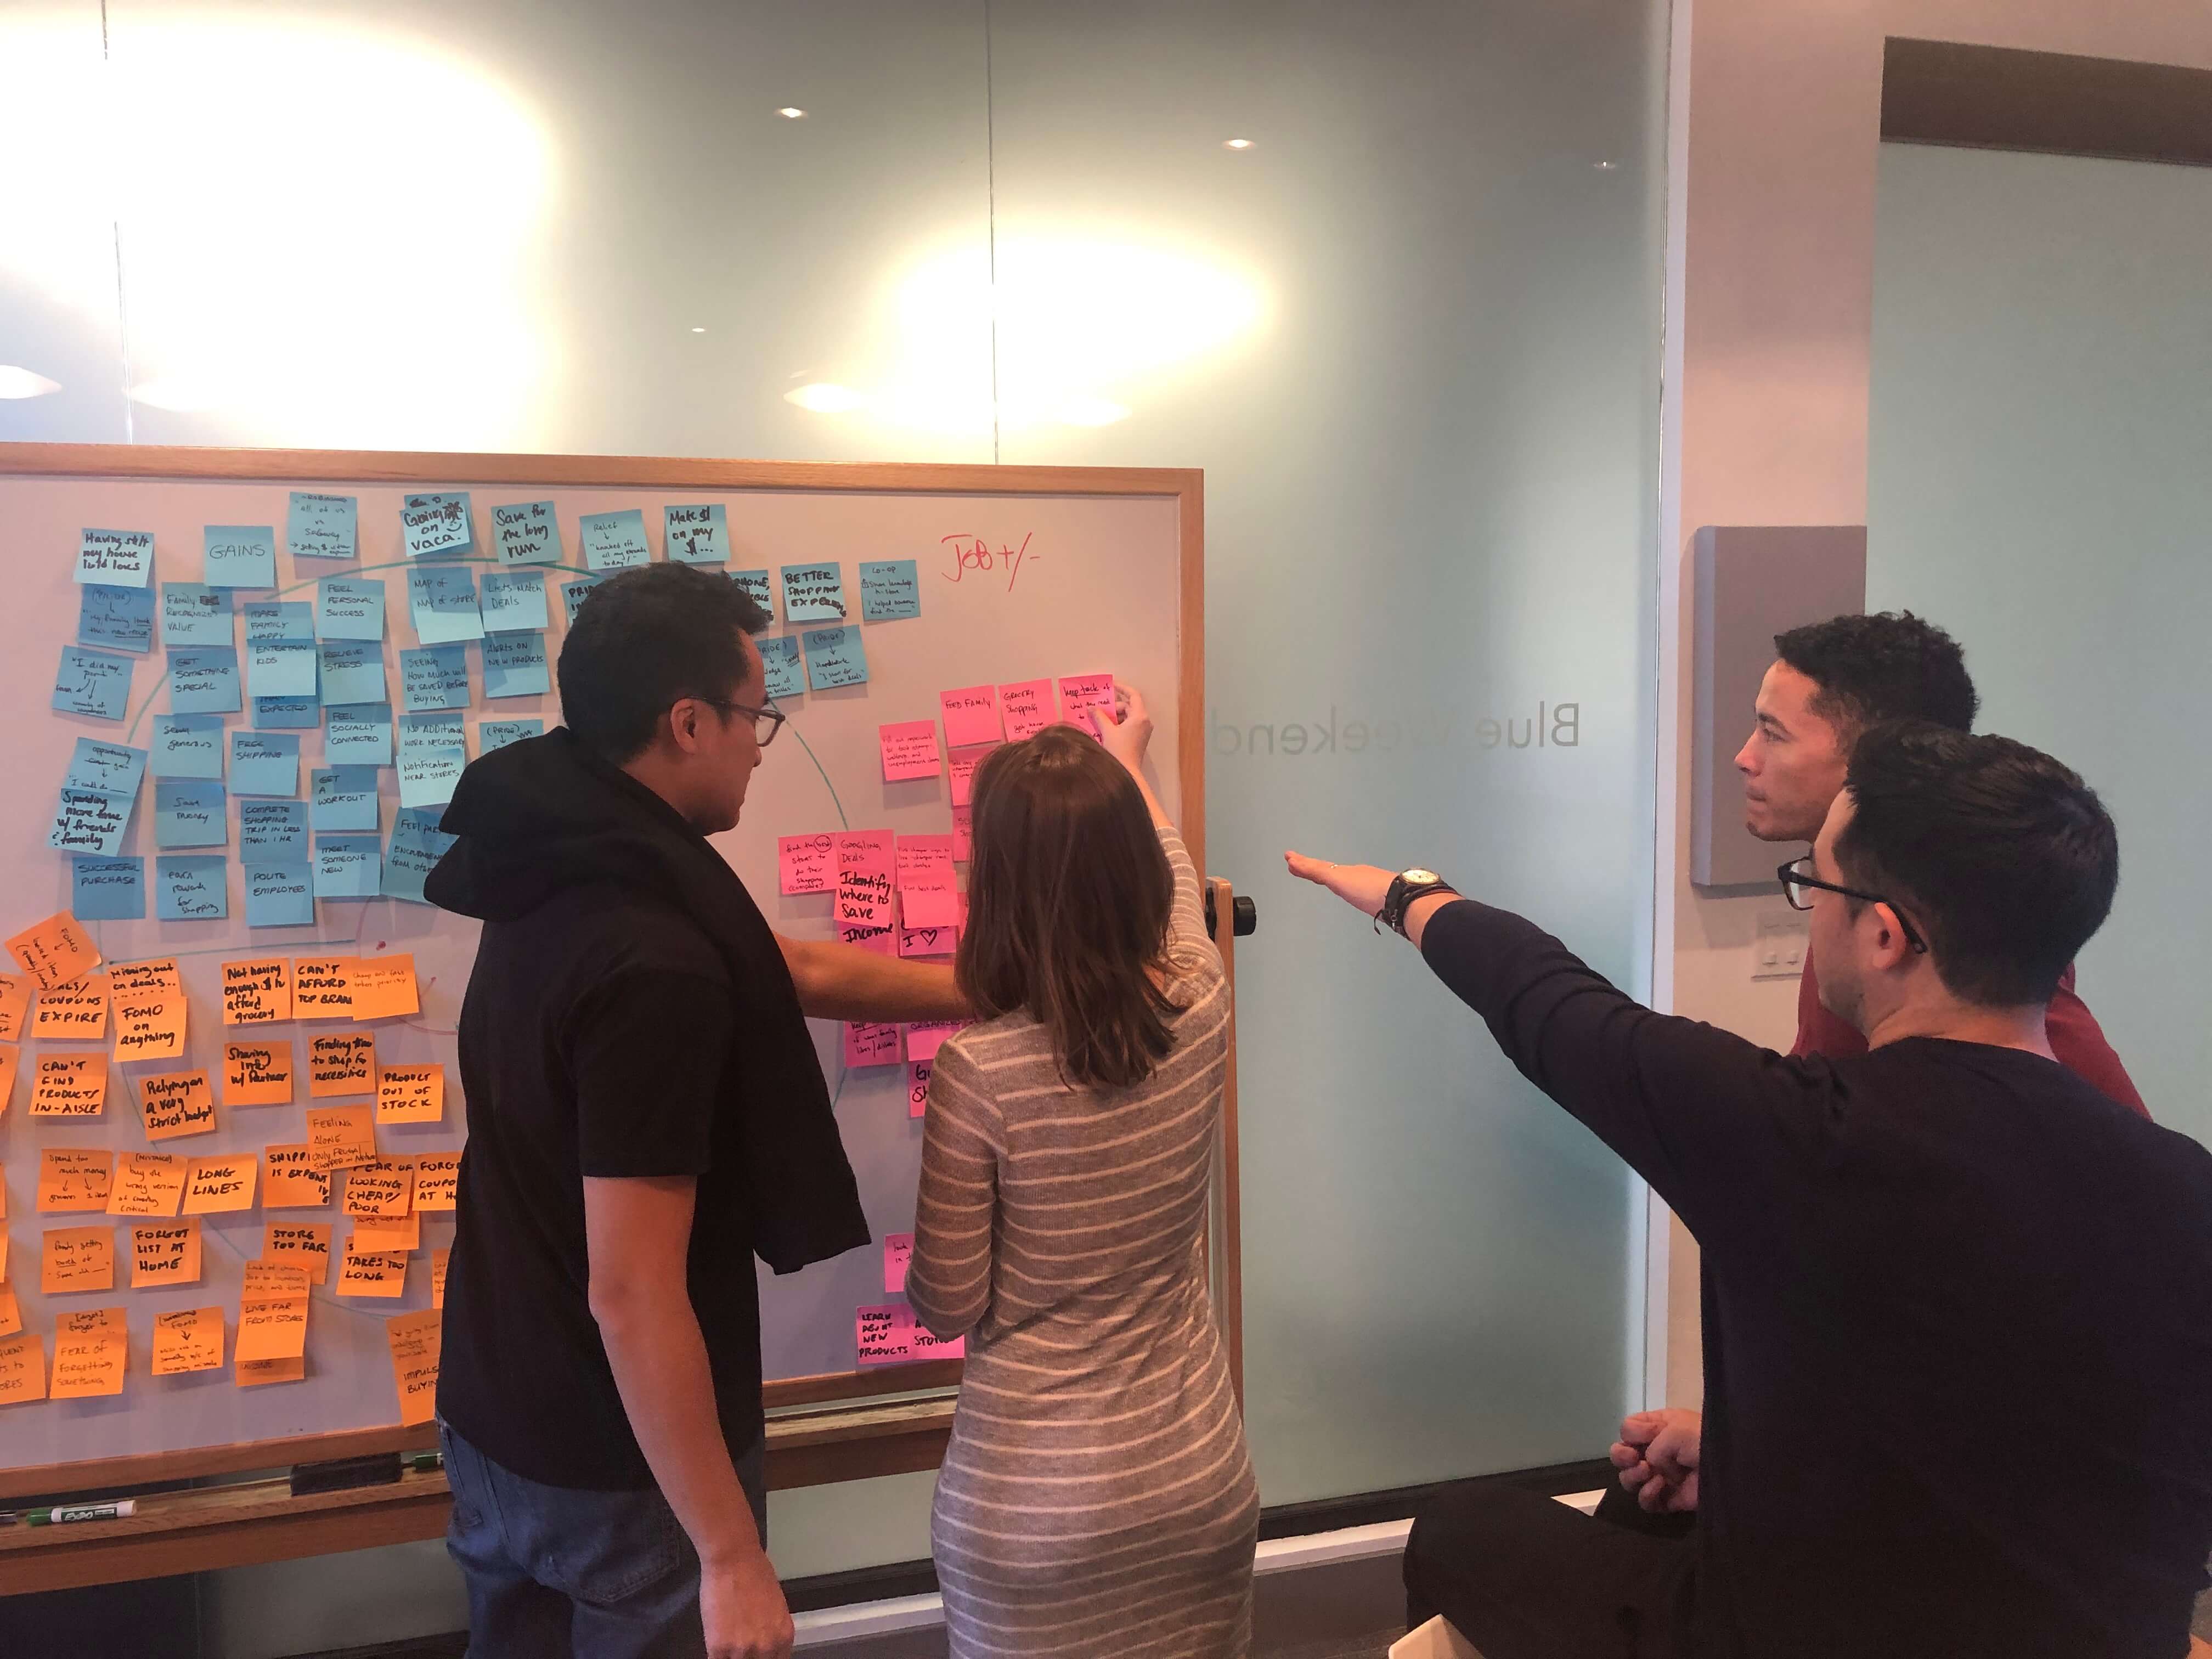
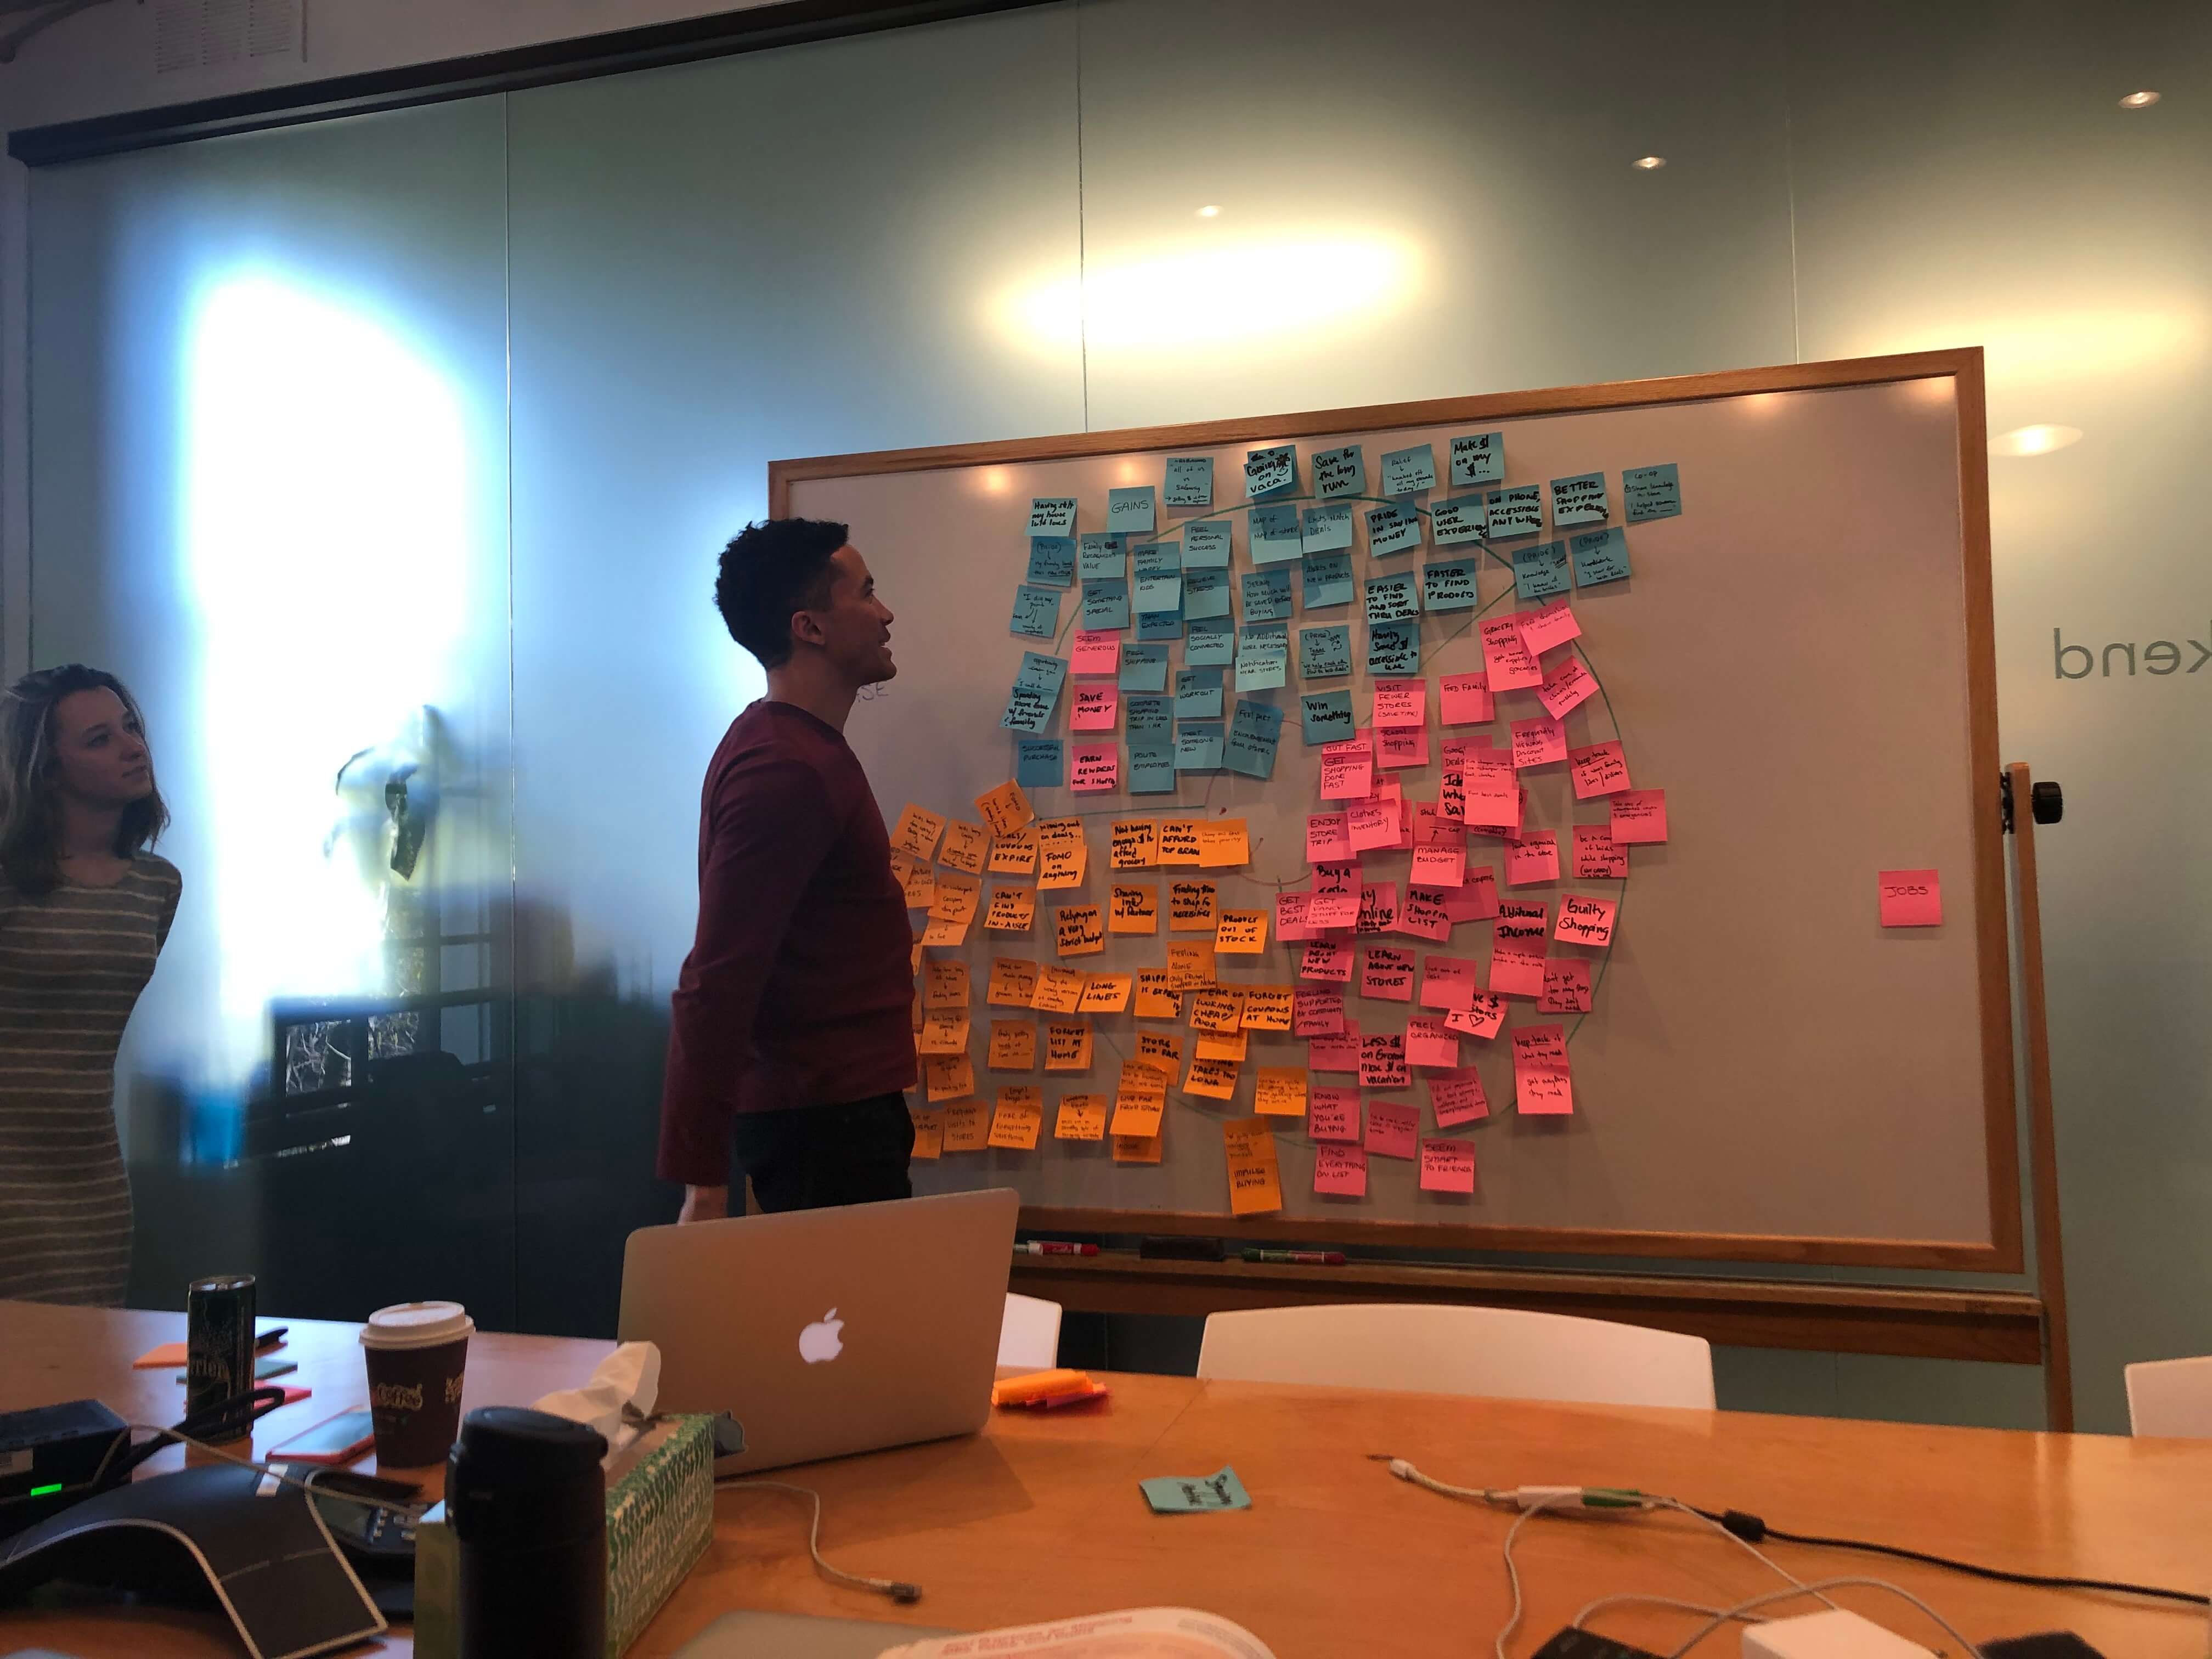
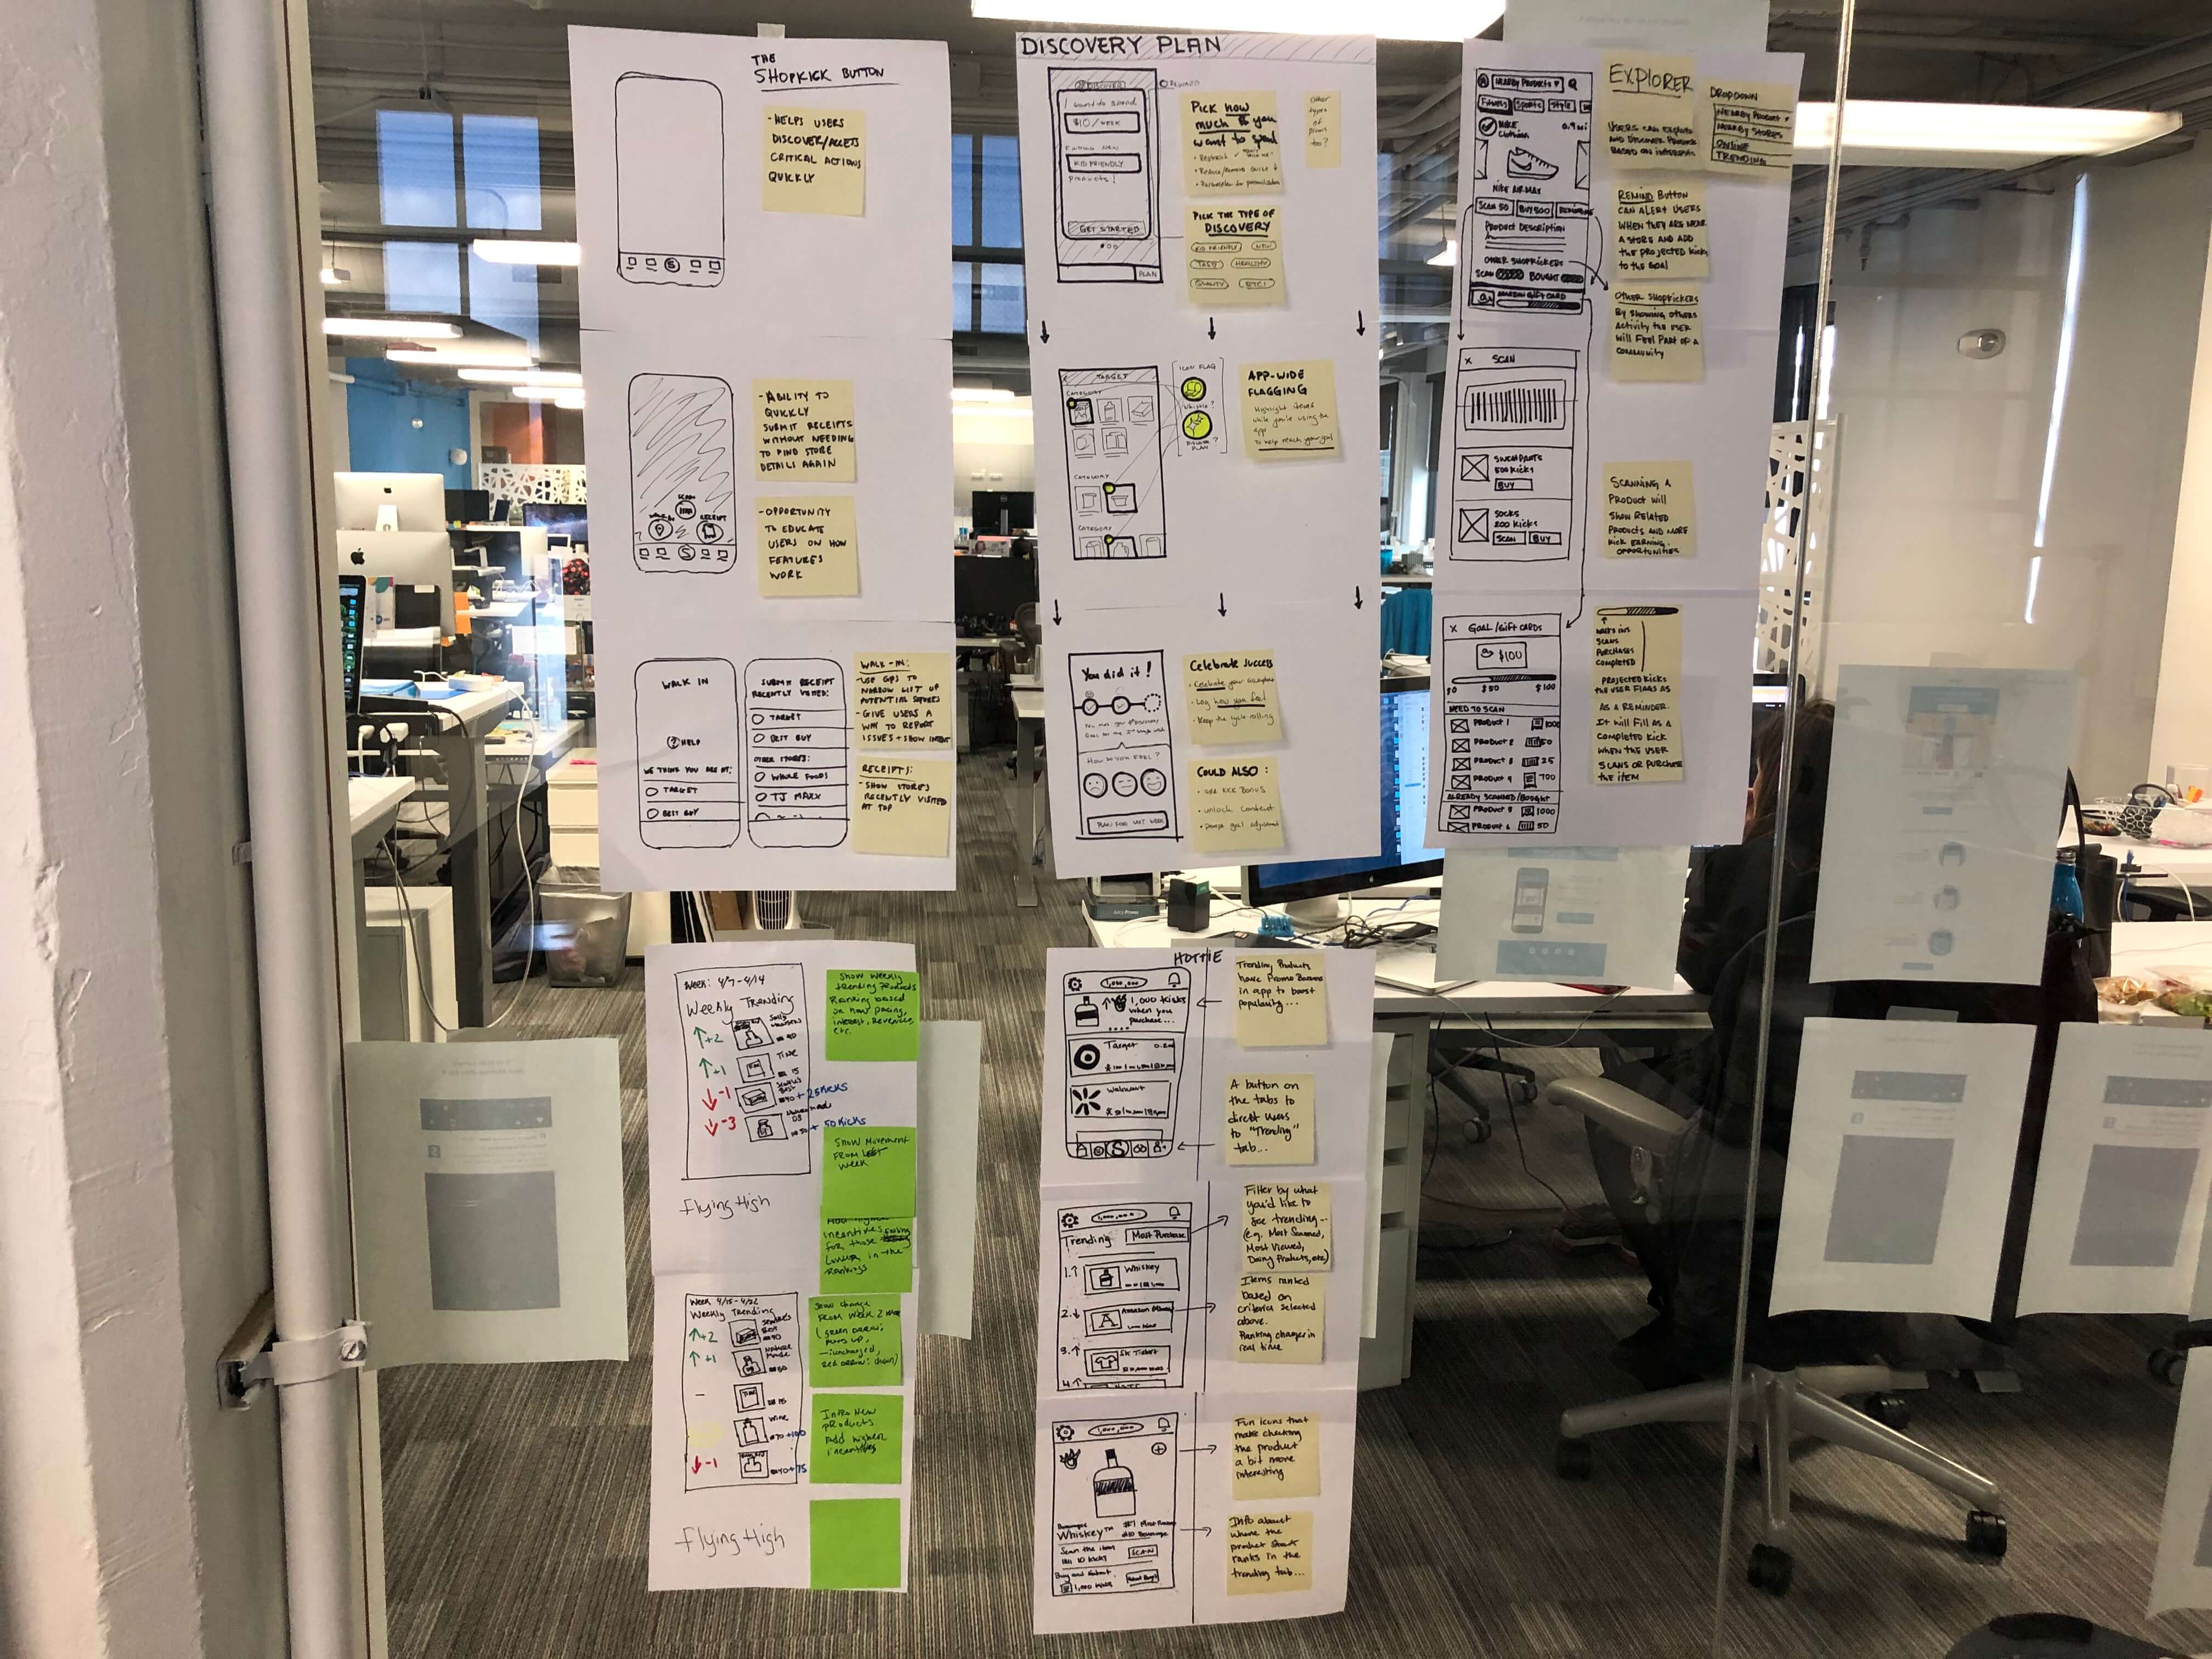
Value prop exercises
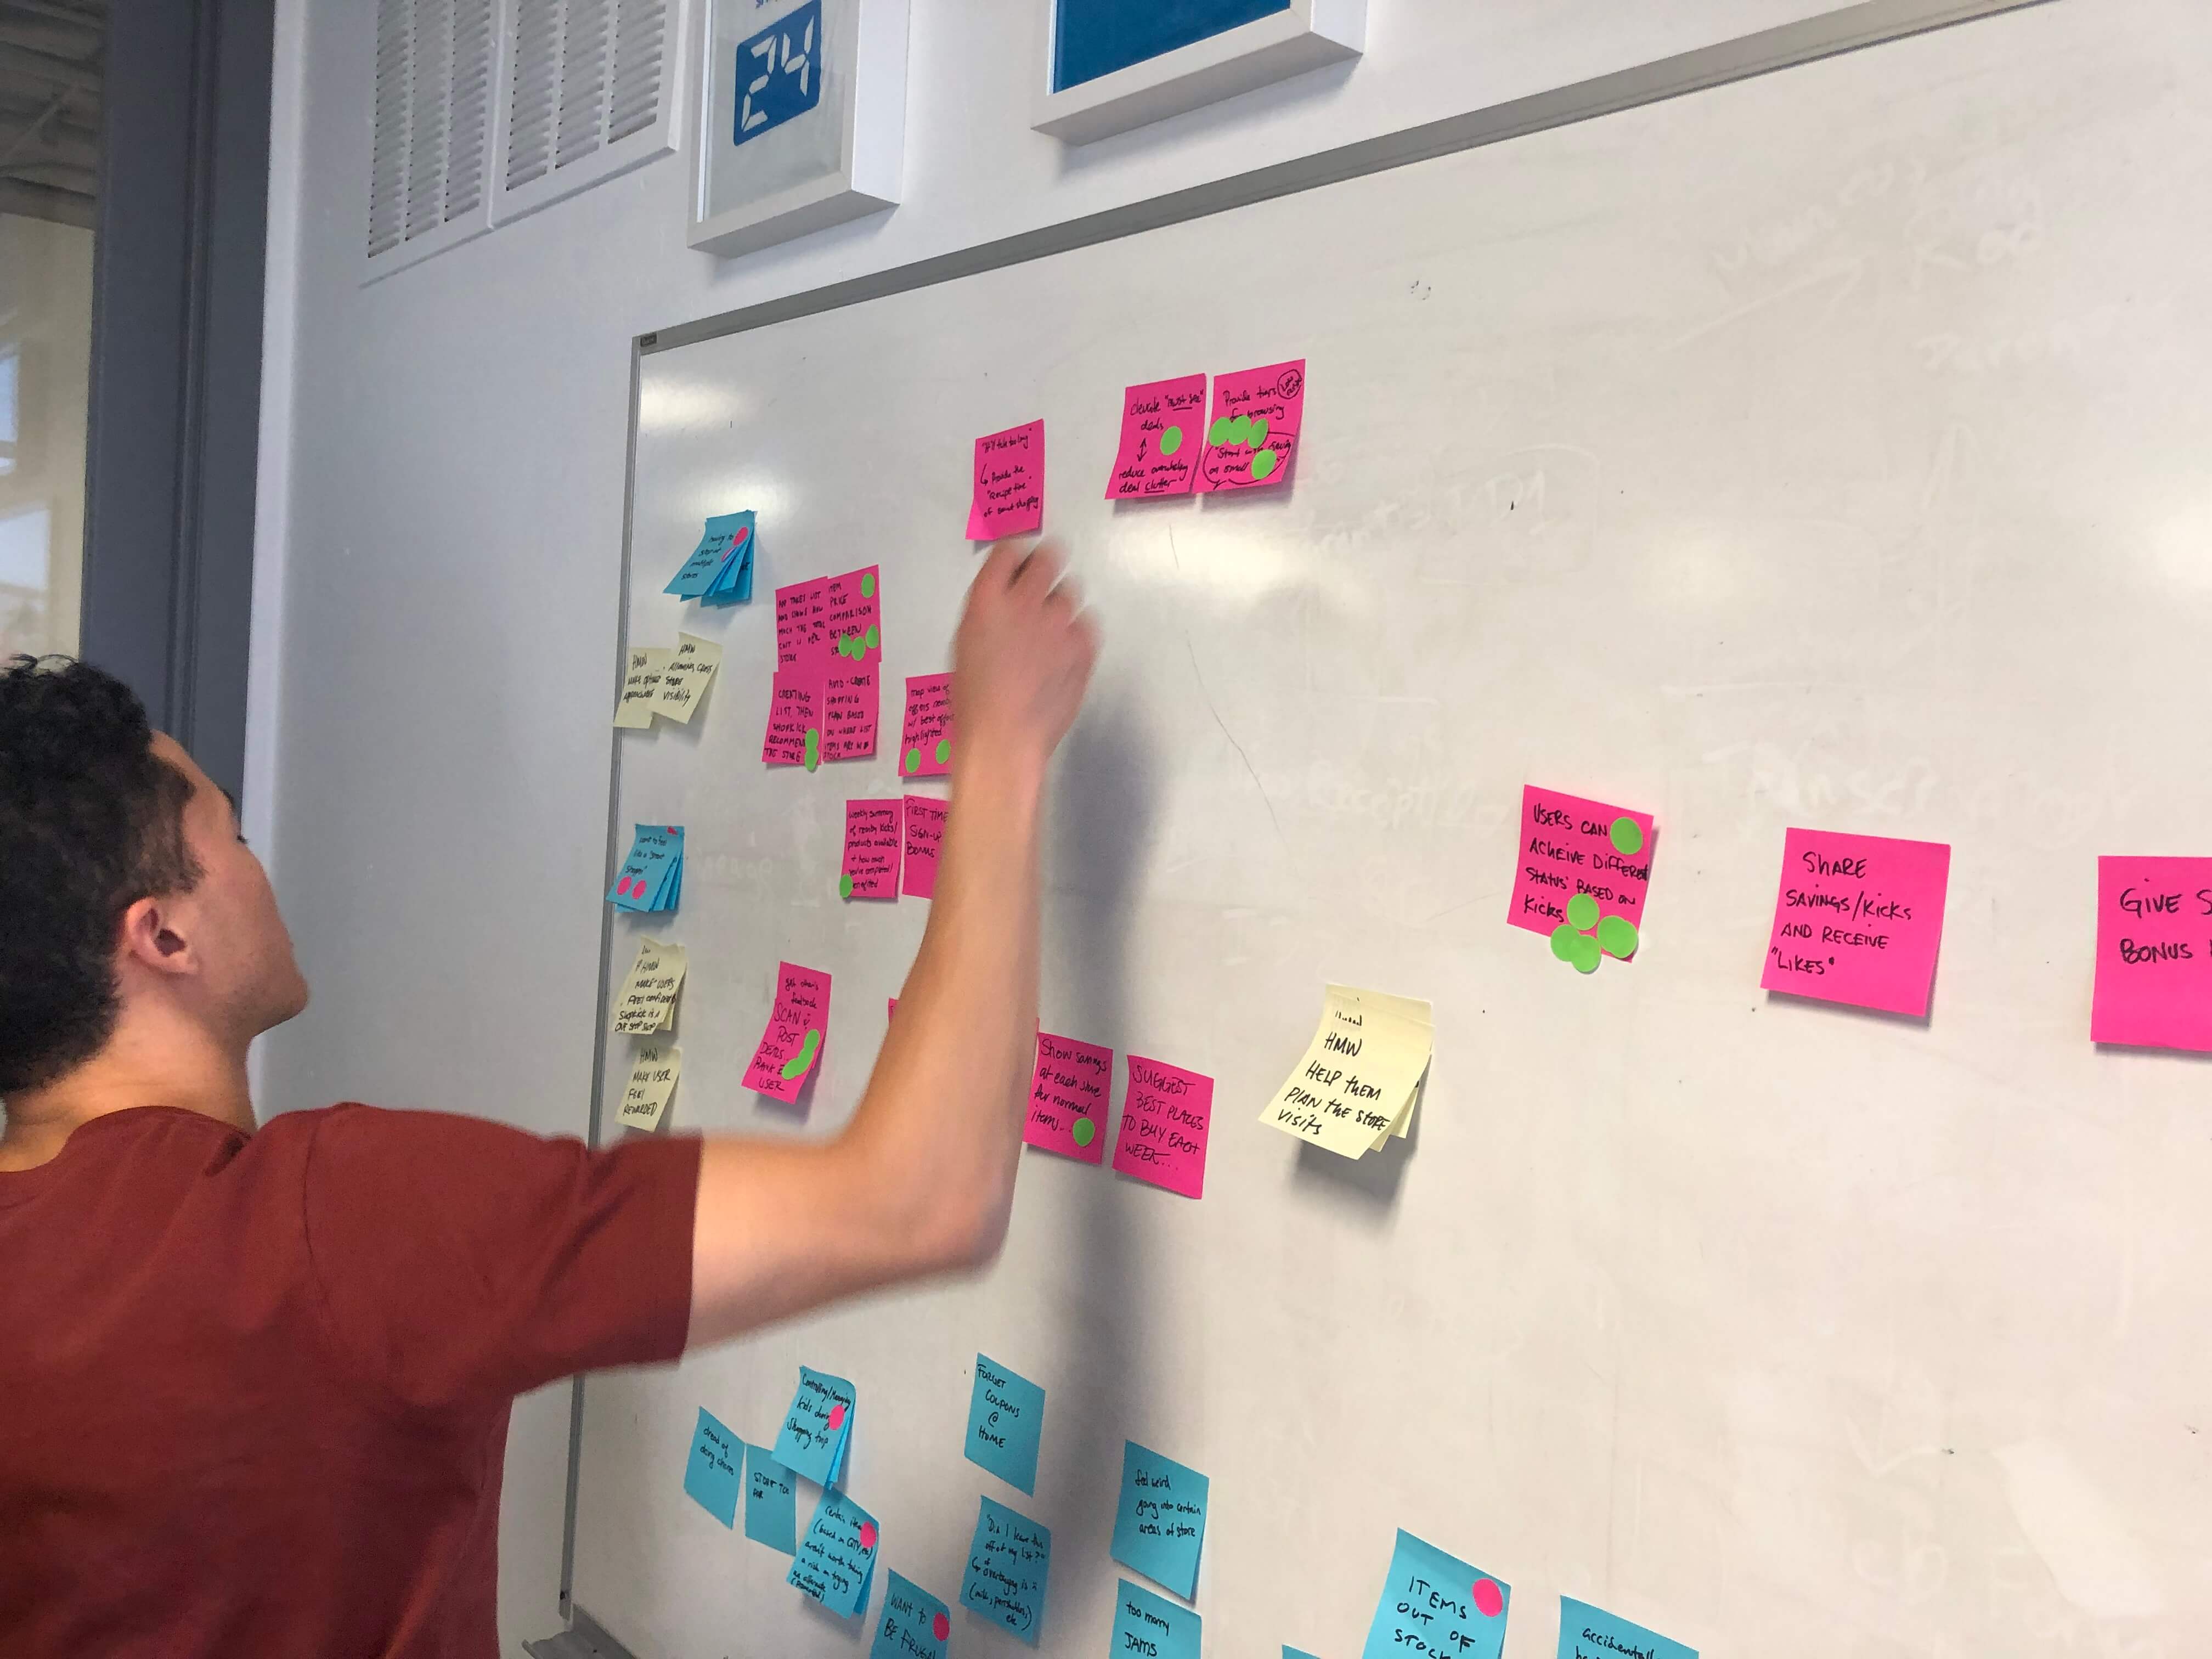
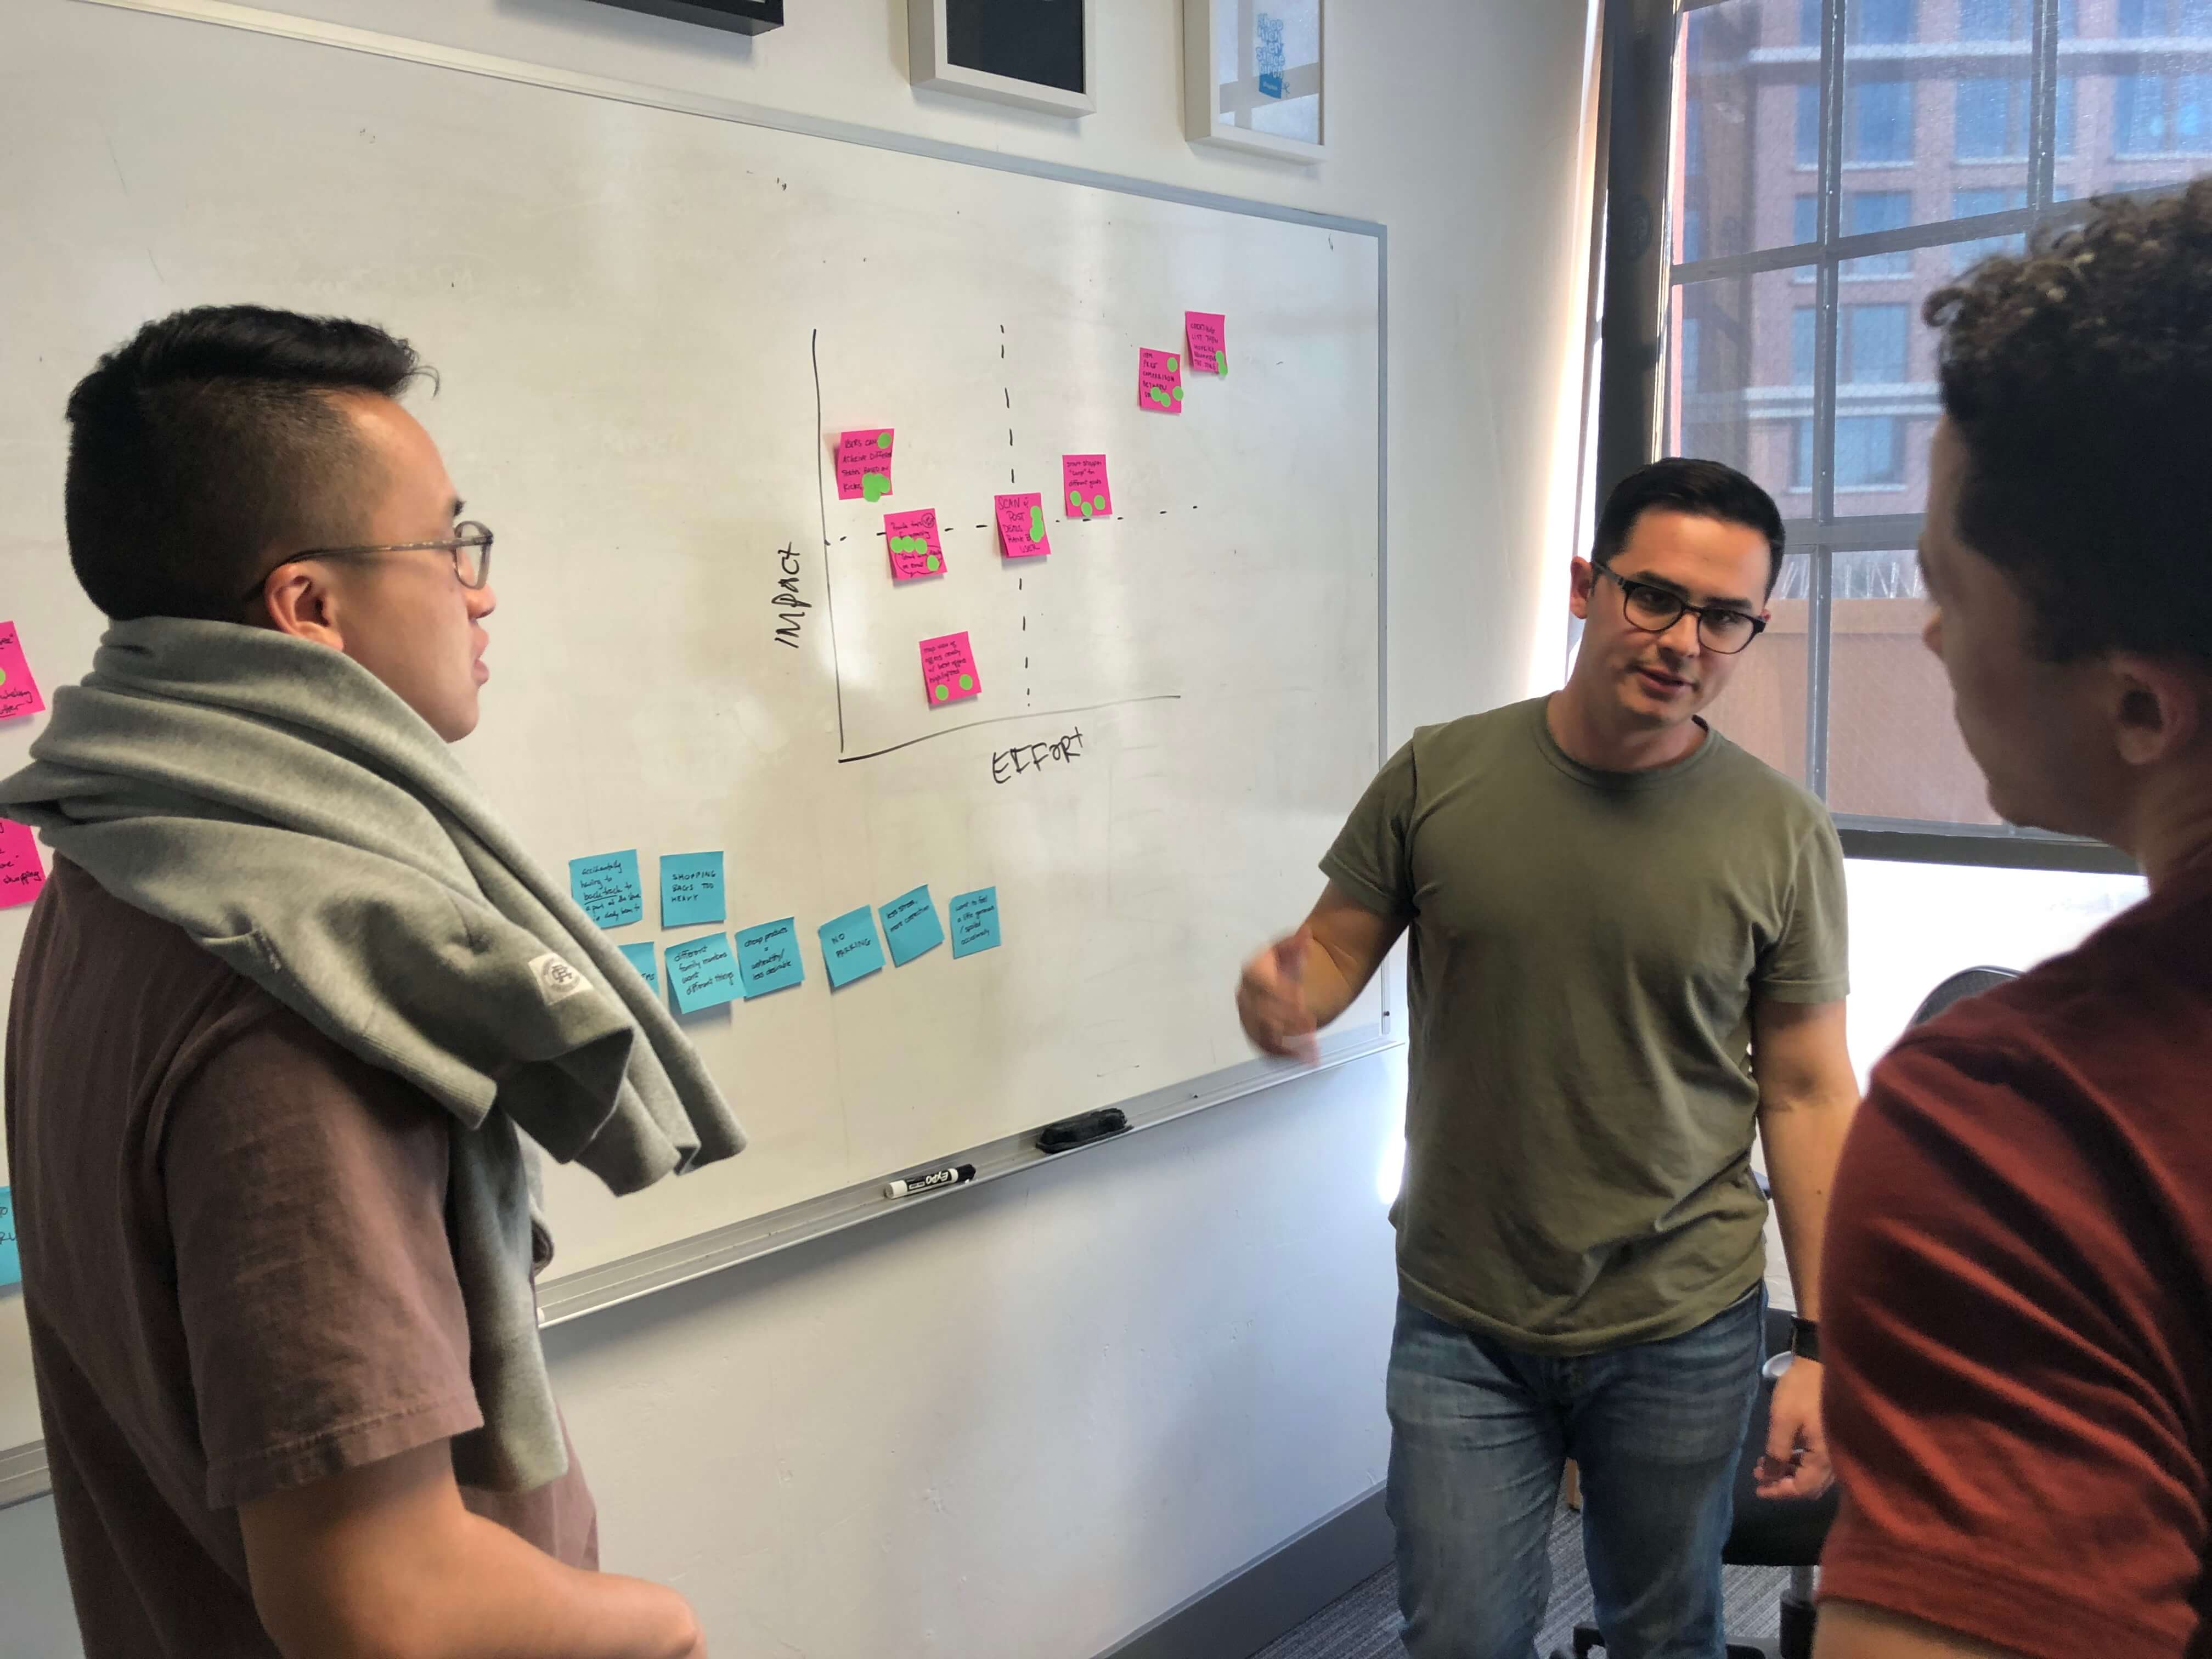
Voting on ideas based on internal knowledge and adding the highest rated ideas to an Impact/Effort grid
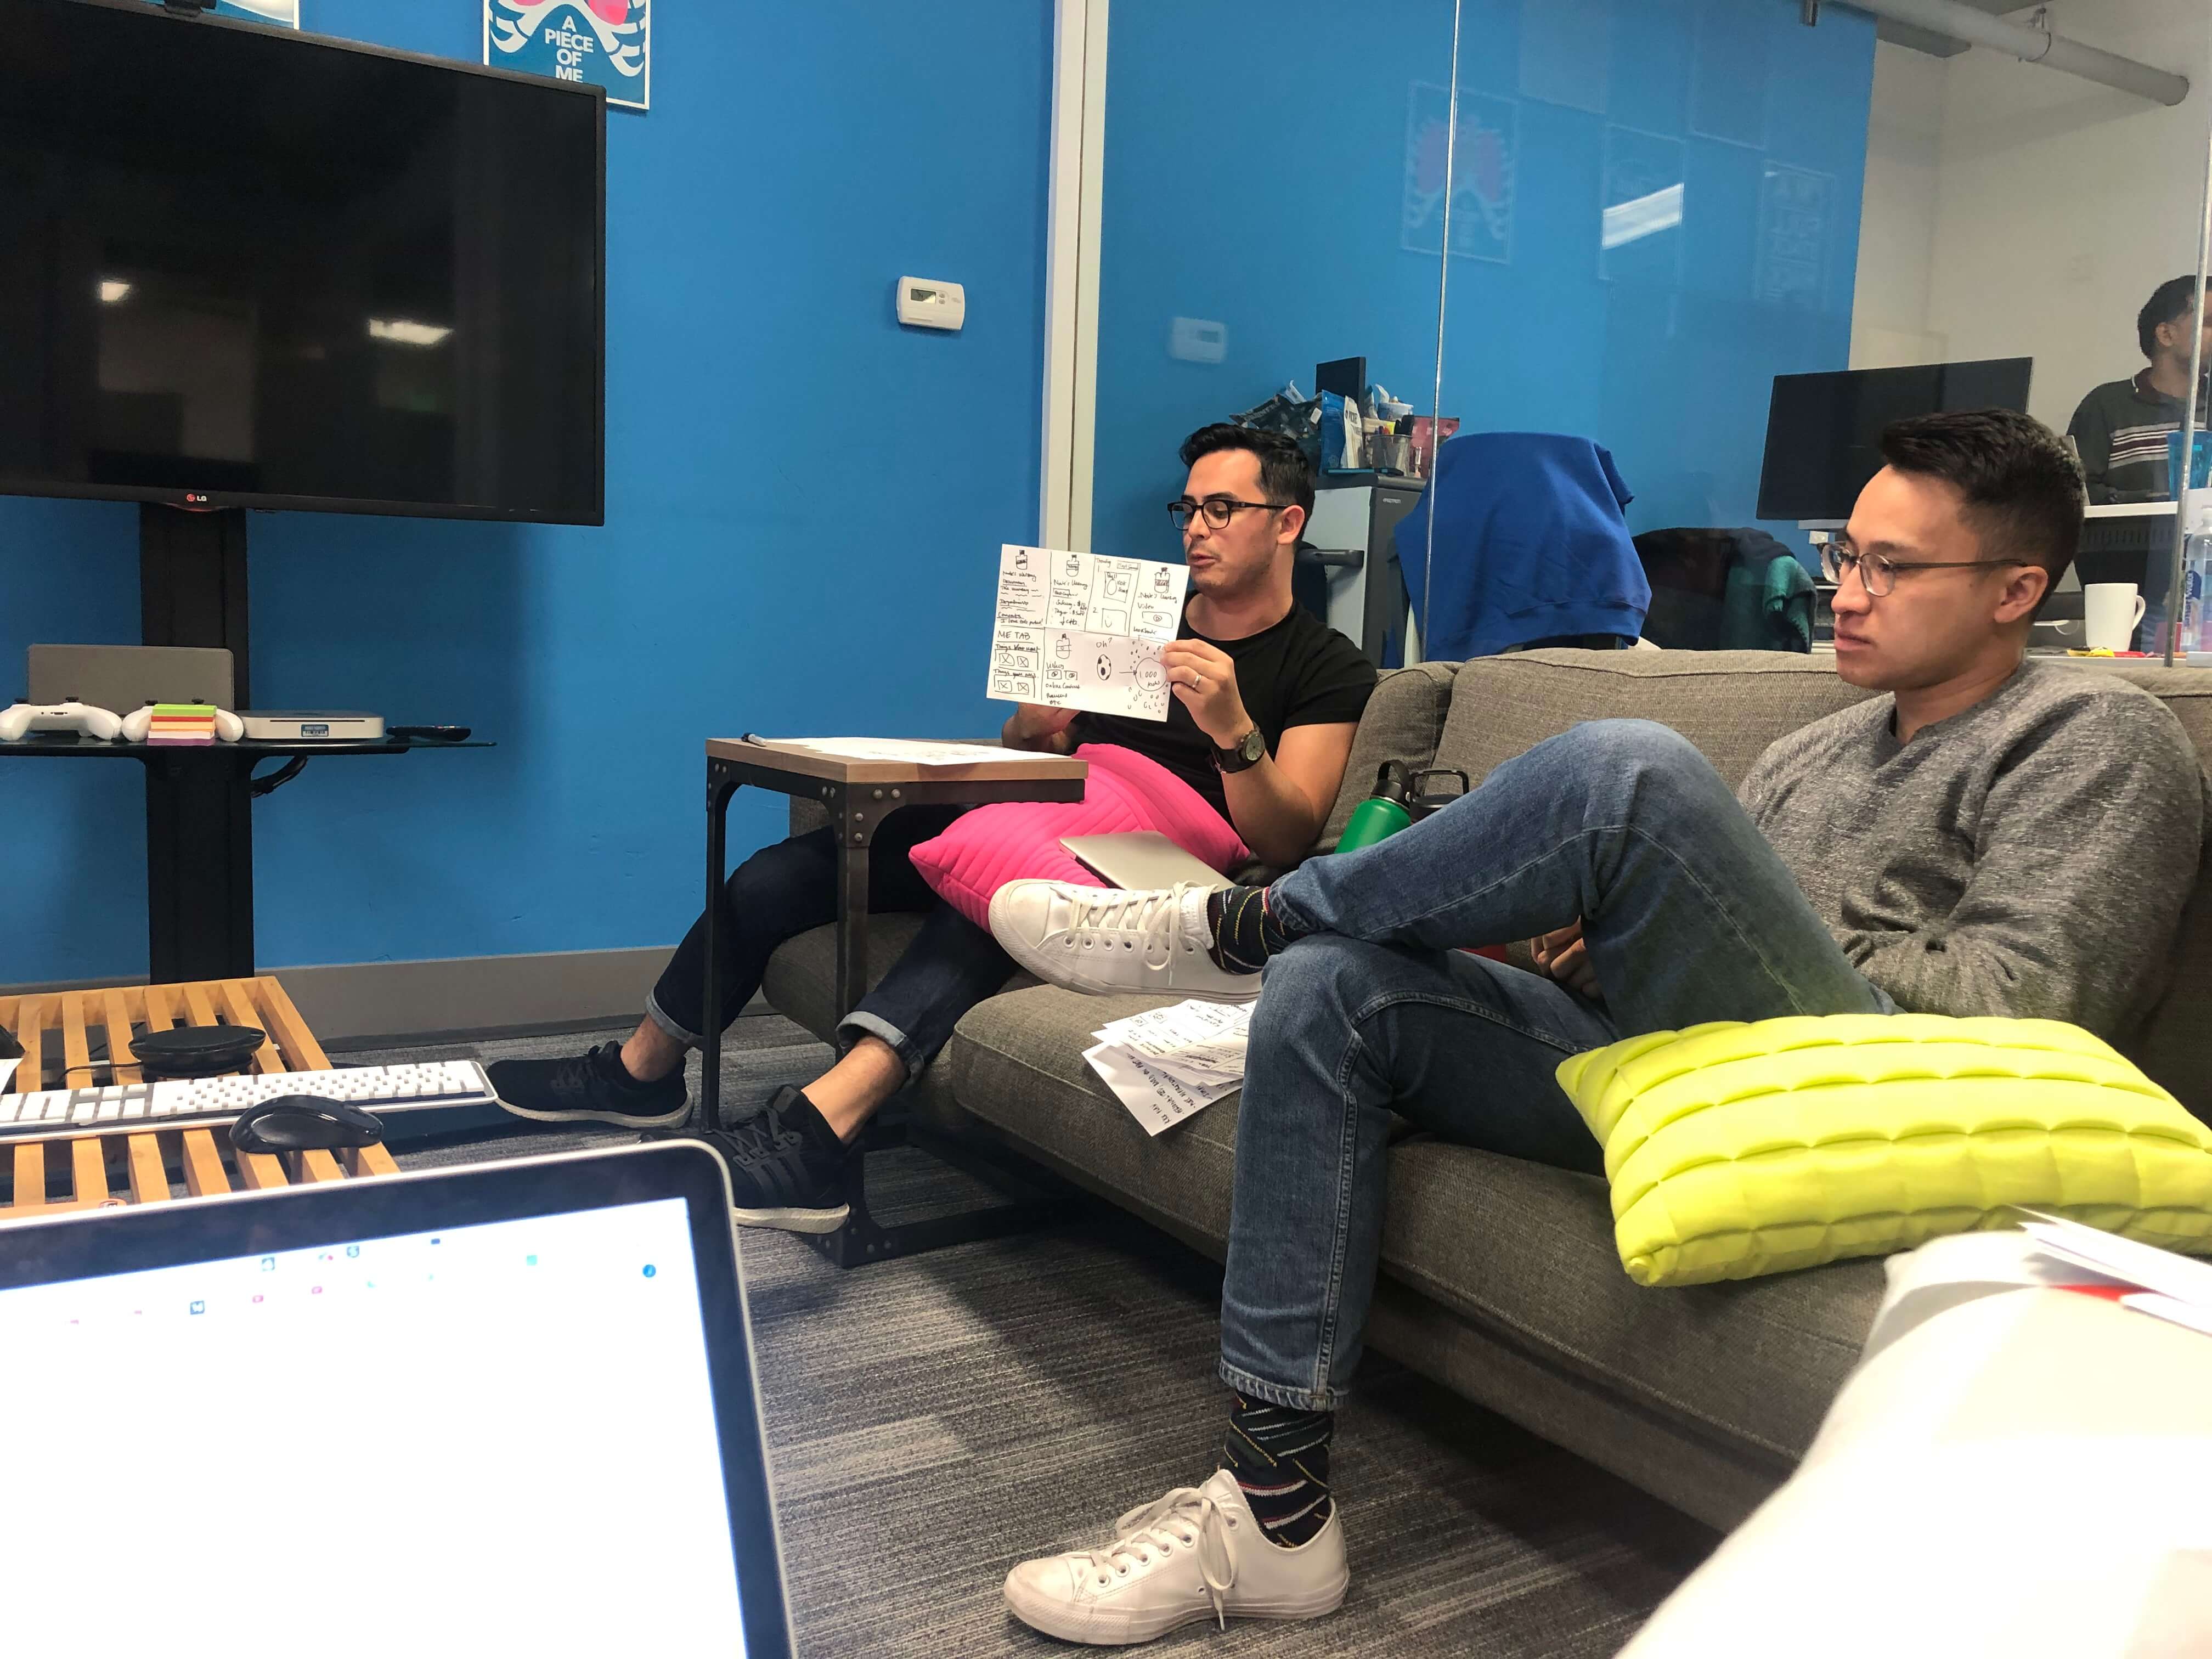
Sketches during a Lightning Decision Jam
Generative interviews
As we worked on improving the existing app we also conducted exploratory interviews that would generate new ideas and drive value to the market. We interviewed 7 candidates that had some interest and experience in using other rewards apps or loyalty programs. Once we downloaded and analyzed the data from the interviews, we then shared it with the team and had them participate in converting the findings into How Might We's.
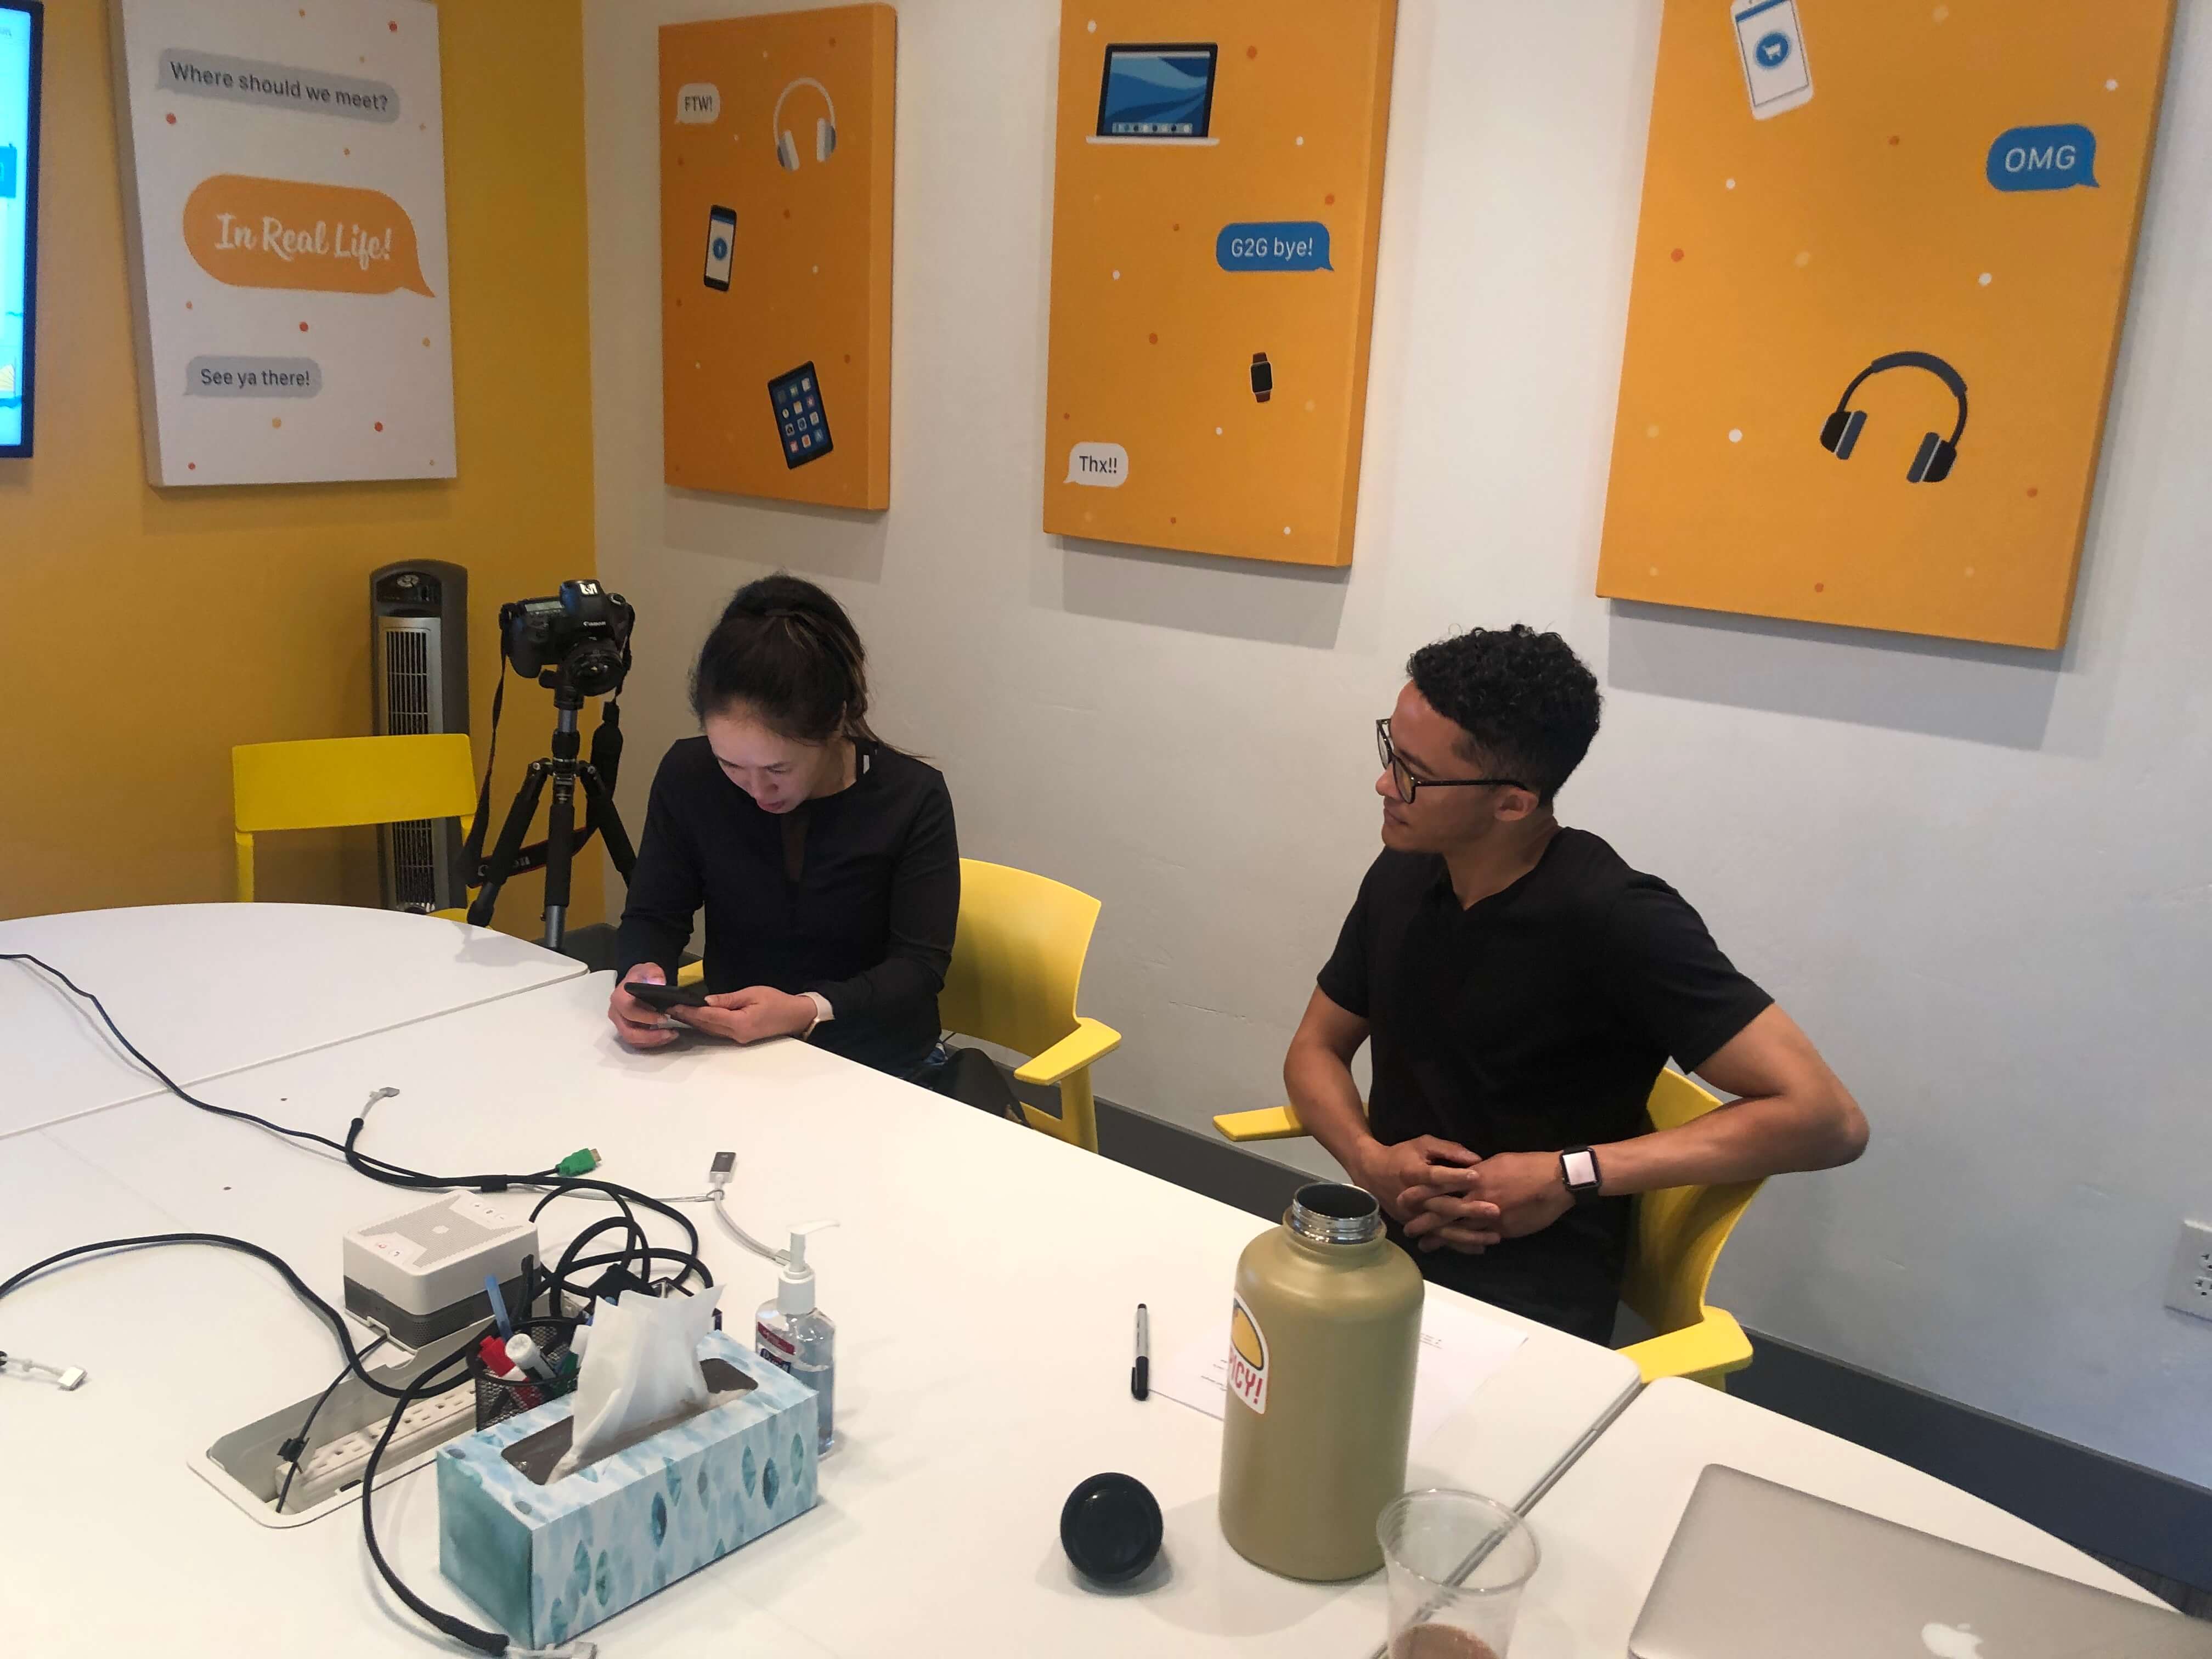
On-site user testing
Many of our designs were testing through usertesting.com but we made an effort to have face-to-face with some of our active users and introduce and test some new ideas we gathered from all of our previous research.
Solutions & Outcomes
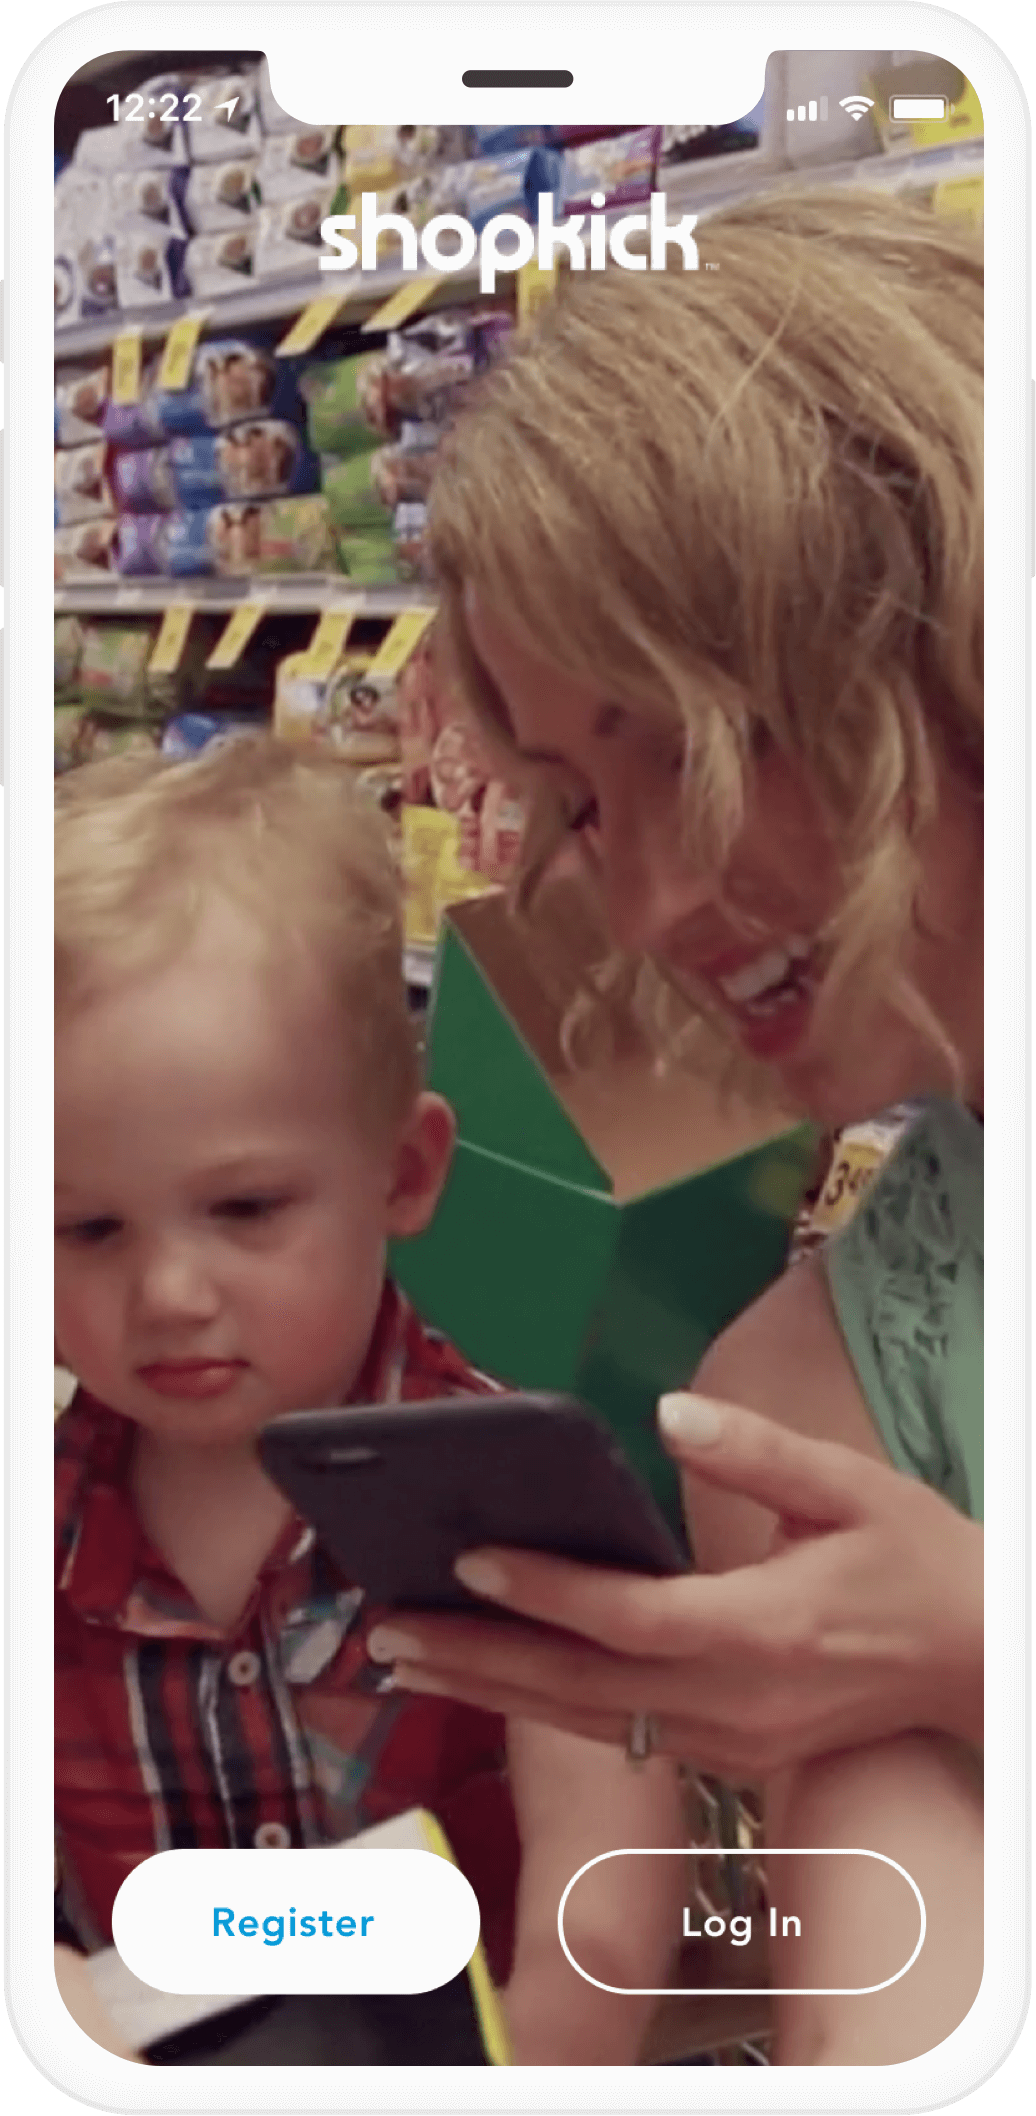
Improved registration
Registration had a 18% dropoff in the initial screen. Also, we assumed the high deactivation number when a user first registered was due to us not having a strong first impression and not understanding how Shopkick would fit into their life.
The solution we provided was to show a video on the sign up page and a 1 page registration instead of 3 in hopes to get the users into the app quicker.
Success metric:
There was a 5% improvement in activation in users first week.
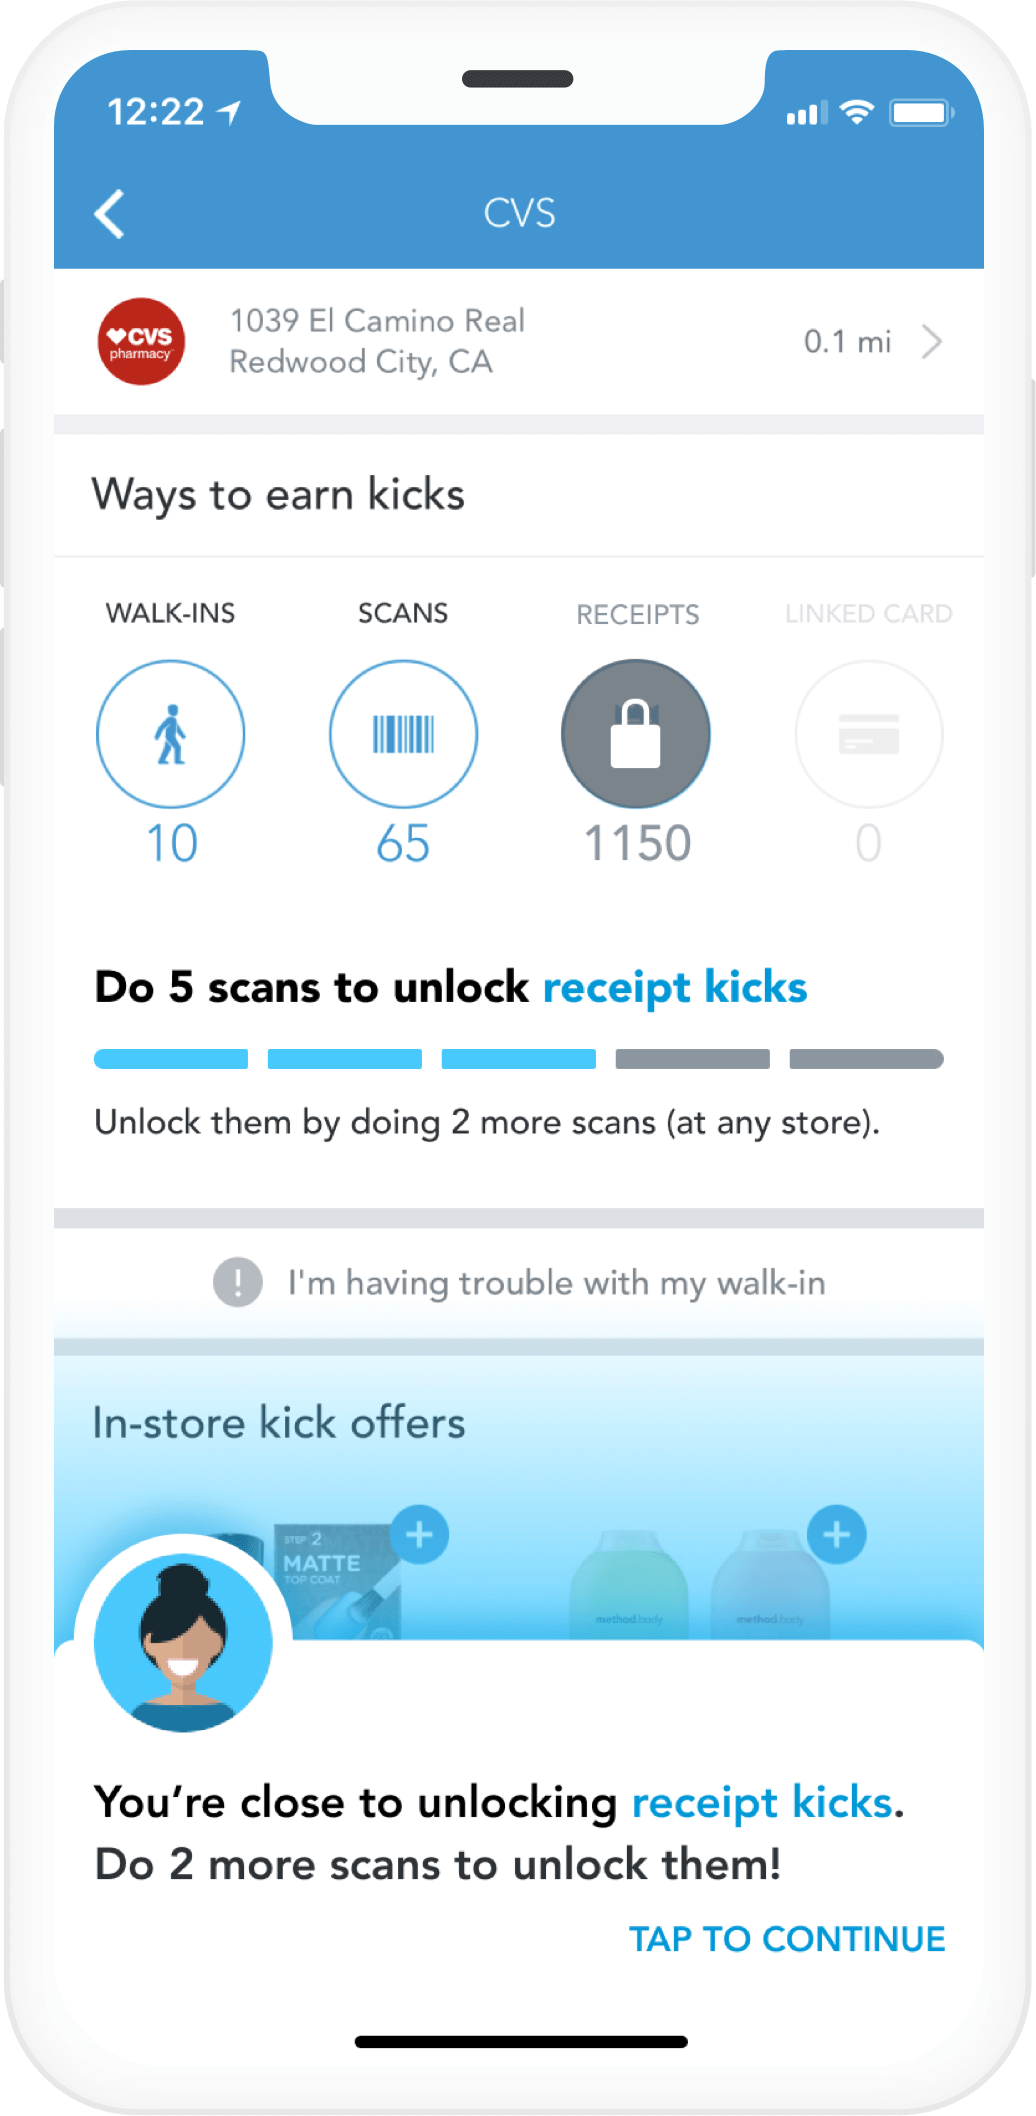
Locking receipt (Gamification)
We wanted to lead potential customers towards a desired goal by gamifying the app. Our first experiment towards accomplishing this was to lock the action (uploading receipts) that would lead users to the most amount of points. In the journey to unlock receipts, users would get positive reinforcement for actions leading up to the goal, such as walking into a store and scanning products.
Success metric:
Purchase actions is up 55% and volume of purchases went up 33%
Drive Delight
One way we wanted to create delight was through the use of animation and showing success with a more celebratory kick bubble once kicks (or points) were unlocked. We tested multiple animations and transitions over a 8 week period.
Success metric:
Winning bubble drives up to 3.1% more daily kick-earning users over control for existing users and up to 7% more daily kick earning users over control for new users.
Winning bubble drives up to 7.7% more daily purchasers, 5.6% more scanners, 4.6% more video viewers, and 3.3% more walkers over control.